Author Archive

Antarctica: ice gain or loss?

November 25, 2015

Guest post by Dr. Jan Wuite, Enveo, Innsbruck

A new study released by NASA scientist Jay Zwally and colleagues in the Journal of Glaciology, receiving wide coverage in the media last month, reports an 82 Gigatons per year increase of land ice in Antarctica during the period 2003-2008. The study received much skepticism from other leading scientists in the field, as there are many indications that point at the contrary: ice loss, possibly irreversible. How does this new study fit in that picture, what are the consequences for expected sea level rise and are these numbers correct? Glaciologist and polar scientist Jan Wuite, working at Enveo in Innsbruck and involved in various international studies related to Antarctica explains.

One of the adverse consequences of climate change is global sea level rise. At more than 3 mm per year, the current sea level rises twice as fast as during the 20th century. The expectations are a rise of at least 70 cm by the turn of this century. The principal causes are clear: global decline of land ice (mountain glaciers & ice sheets) and thermal expansion of ocean water (water expands as it becomes warmer). To clarify, land ice is resting on land and can reach a thicknesses of up to several kilometers, in contrast to seasonally restricted sea ice (mainly just frozen ocean water), that is typically only a few meters thick and has no direct influence on sea level. Studies have indicated an increasing contribution of the two largest ice sheets, the Greenland and Antarctic ice sheets, to sea level rise.

The largest unknown for future sea level rise is caused by uncertainty in the predicted response of the Antarctic ice sheet to global warming. As warmer air can hold more moisture, it is possible that increasing snow accumulation compensates part of the sea level rise. On the other hand it is also possible that ice drains faster to the oceans accelerating it.

There is a lot of ice in Antarctica; in some places the ice thickness reaches well over 4 km. There is enough ice to, when melted completely, raise global sea levels with roughly 58 m. But even if only a small part of that melts it could have a significant impact on coastal communities, or ocean circulation. For this reason scientists are very interested in mass changes of the ice sheets: the mass balance.

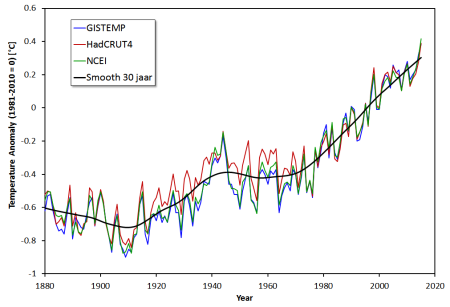
Figure 1. An illustration of key processes determining ice sheet mass balance. Source: Zwally et al figure 1.

(more…)

A warm 2015 and model –data comparisons

August 7, 2015

Guest post by Jos Hagelaars. Dutch version is here.

Discussions on the Internet regarding climate change are sometimes about scientific details, sometimes about the climate sensitivity regarding the equilibrium situation hundreds of years from now, but the most prevalent discussion topic is probably: the global average temperature. Will it get warmer or colder, is there a temporary slowdown or acceleration in the rise in temperature, are the models correct or not, will the eventual warming of our earth in the future be large or small? New numbers are released on a monthly basis and every month megabytes of text are generated about them. My forecast is that 2015 again will lead to a discussion-spike.

The graph above shows the evolution of the global surface temperature anomaly for three datasets, where the average of the period 1981-2010 is defined as 0. For the year 2015 only data are presented up to and including June. So far 2015 exceeds all other years and the evolving El Niño makes it likely that 2015 will set a new world record.
(more…)

Is Climate Science falsifiable?

February 17, 2014

Guest post by Hans Custers. Nederlandse versie hier.

A very, ehhrmm… interesting piece on
Variable Variability, Victor Venema’s blog: Interesting what the interesting Judith Curry finds interesting. And I don’t mean interesting in a rhetoric, suggestive way; I mean it is a well-written and well-reasoned article, worth reading.

Victor writes about the meme regularly used by the anti climate science campaign, often supported by some straw man arguments, that the science of human impacts on climate would not be falsifiable. He shows it’s nonsense, by giving some examples of how it could be falsified. Or, more likely, already would have been falsified, if the science would be wrong. Victor’s post inspired me to think of more options to falsify generally accepted viewpoints in climate science. If there are any ‘climate change skeptics’ who want to contribute to real science, they might see this as a challenge. Maybe they can come up with a research proposal, based on one of the options for falsification. Like proper scientists would do.

First, a few more things about falsifiability in general. Bart wrote a concise post about the subject four years ago, explaining that a bird in the sky does not disprove gravity. What looks like a refutation at first, might on second thoughts be based on partial or total misunderstanding of the hypothesis. Natural climate forcings and variations do not exclude human impacts. Therefore, the existence of these natural factors in itself, cannot falsify anthropogenic climate change. A real skeptic is cautious about both scientific evidence and refutations. ‘Climate change skeptics’ like to mention the single black swan, that disproves the hypothesis that all swans are white. Of course that is true, unless that single black swan appears to be found near some oil spill.

Some of the falsifications that I mention later on might be somewhat cheap, or far-fetched. It is not very easy to find options to falsify the science of human impacts on climate. Not because climate scientists don’t respect philosophical principles of science, but simply because there’s such a huge amount of evidence. There are not a lot of findings that would disprove all the evidence at once. A scientific revolution of this magnitude only happens very rarely. Whoever thinks differently, doesn’t understand how science works. (more…)

The Dutch view on the future of the IPCC – what it does and what it does not say

July 15, 2013

Guest post by Hans Custers. Dutch version is here.

The IPCC invited the governments of all participating countries to give their view on the future of the climate panel. The IPCC is a complex organization, dealing with a very complex subject, so perfection will be impossible to achieve. Or, from an optimistic point of view: there’s always room for improvement. And of course, a transparent process of self-reflection is a very good start for improvements. But well, this is the IPCC, so there is a catch. Whatever happens in this process, it will be spun by the anti IPCC and anti climate science campaign as ‘evidence’ for their claims. Every bit of criticism on the IPCC’s procedures and methods will be spun as substantial criticism on the scientific content of the assessment reports. And if governments would be reluctant to criticize, because they know it will be taken out of context, it would be seen as ‘evidence’ for the huge climate conspiracy.

The Netherlands has finished their submission and it was published (pdf) on KNMI’s website early last month. In my opinion they did what they should have done: they presented a straightforward view, not worrying about the inevitable spin by the skeptic campaign. And, oh yeah, inevitable it was. The next quote appeared in internet discussions again and again, after skeptics found the submission:

The IPCC needs to adjust its principles. We believe that limiting the scope of the IPCC to human-induced climate change is undesirable, especially because natural climate change is a crucial part of the total understanding of the climate system, including human-induced climate change. The Netherlands is also of the opinion that the word ‘comprehensive’ may have to be deleted, because producing comprehensive assessments becomes virtually impossible with the ever expanding body of knowledge and IPCC may be more relevant by producing more special reports on topics that are new and controversial.

Skeptics don’t seem to understand, or don’t want to understand, that this is about the IPCC organization only, and not about the content of assessment reports, or even climate science in general. They suggest the Dutch government thinks that natural influences and controversial topics may have been underestimated in previous assessments. There are some things they overlook.

(more…)

Melting of the Arctic sea ice

March 25, 2013

Guest post by Jos Hagelaars. Dutch version is here.

This was the title of a discussion that was held on the recently launched website ClimateDialogue regarding the possible causes of the decline in Arctic sea ice over the past decades. Three experts participated in this discussion: Walt Meier, Research Scientist at the NSIDC, Judith Curry, professor at Georgia Institute of Technology and Ron Lindsay, Senior Principal Physicist at the Polar Science Center of the University of Washington.

In this blog post I will start off with a description of the observations of the Arctic region, followed by a short overview of the potential causes of the decline in Arctic sea ice, incorporating the views of the three experts as they were expressed on ClimateDialogue. The final parts concern the uniqueness of this decline in a historical perspective and the possibility of having an ice-free Arctic in the summer in the not too distant future.

.
Observations of the Arctic region since 1979

Since 1979 the Arctic region has been extensively monitored by satellites. They detect e.g. the ice surface area, the extent of the area covered with ice and also the total amount or volume of ice. The results of these observations are startling. For example, sea ice area and the amount of perennial (multi-year) ice has decreased dramatically over the past 3 decades, as is visualized by the images in figure 1 and 2, generated by NASA (see here and here).

(more…)

The two epochs of Marcott

March 19, 2013

Guest post by Jos Hagelaars. Dutch version is here.

The big picture (or as some call it: the Wheelchair): Global average temperature since the last ice age (20,000 BC) up to the not-too distant future (2100) under a middle-of-the-road emission scenario.

Shakun_Marcott_HadCRUT4_A1B_Eng

Figure 1: The temperature reconstruction of Shakun et al (green – shifted manually by 0.25 degrees), of Marcott et al (blue), combined with the instrumental period data from HadCRUT4 (red) and the model average of IPCC projections for the A1B scenario up to 2100 (orange).

Earlier this month an article was published in Science about a temperature reconstruction regarding the past 11,000 years. The lead author is Shaun Marcott from Oregon State University and the second author Jeremy Shakun, who may be familiar from the interesting study that was published last year on the relationship between CO2 and temperature during the last deglaciation. The temperature reconstruction of Marcott is the first one that covers the entire period of the Holocene. Naturally this reconstruction is not  perfect, and some details will probably change in the future. A normal part of the scientific process.

(more…)

Response to John Christy’s blog post regarding ‘Klotzbach Revisited’

March 5, 2013

Guest blog by Jos Hagelaars

Dr. John Christy wrote an extensive blog post as a response to my Dutch ‘Klotzbach Revisited’ post (English version here), it is published on “Staat van het Klimaat” and WUWT. I would like to thank Dr. Christy for his interest in my writings.

I have some remarks regarding Dr. Christy’s post, which are addressed in this ‘response-post’ and are built upon some quotes taken from Dr. Christy’s response.
For reference, the original Klotzbach et al 2009 paper (K-2009 in the text) can be found here and the correction paper (K-2010) can be found here.

“Klotzbach et al.’s main point was that a direct comparison of the relationship of the magnitude of surface temperature trends vs. temperature trends of the troposphere revealed an inconsistency with model projections of the same quantities.”

This ‘main point’ is not present at all in the K-2009 paper, the only reference to real data coming from a climate model in the paper is the amplification factor, which was ‘sort of obtained’ by Ross McKitrick from the GISS-ER model. In the abstract a short conclusion is given: “These findings strongly suggest that there remain important inconsistencies between surface and satellite records.”. No word about models.

In my opinion the main point of K-2009 is the suggestion that the surface temperature record is biased. One third of the paper is made up by paragraph 2 with the title: “Recent Evidence of Biases in the Surface Temperature Record”. K-2009 explicitly state:
In our current paper, we consider the possible existence of a warm bias in the surface temperature trend analyses …

(more…)

Klotzbach Revisited

March 1, 2013

Guest blog by Jos Hagelaars. Dutch version here.

The average surface temperature of the earth, measured by ‘thermometers’, are released by a number of institutes, the most well-known of these datasets are GISTEMP, HadCRUT and NCDC. Since 1979 temperature data for the lower troposphere are released by the University of Alabama in Huntsville (UAH) and Remote Sensing Systems (RSS), which are measured by satellites.
The temperatures of these two methods of measurement show differences, for instance: the NCDC data indicate a trend over land of 0.27 °C/decade for the period 1979 up to and including 2012, while over the same period, the trend based upon the satellite data by UAH over land is significantly lower at 0.18 °C/decade. In contrast, the trends for global temperatures indicate much smaller differences, for NCDC and UAH these are respectively 0.15 °C/decade and 0.14 °C/decade for the same period.

Big deal? Almost everything related to climate is a ‘big deal’, so it is of no surprise that the same applies to these trend differences. In a warming world it is expected that the temperatures of the upper troposphere increase at a higher rate than at the surface, regardless of the cause of the warming. The satellite data (UAH and RSS) do not reflect this. Why is the upper troposphere expected to warm at a higher rate and what is the cause of these trend differences between the surface  and satellite temperatures?

The temperature gradient in the troposphere / the ‘lapse rate’

When you go up in the troposphere it gets colder. This is caused by the fact that rising air will cool down with increasing altitude due to a decrease in pressure with altitude, by means of so-called adiabatic processes. This temperature gradient is called the lapse rate, a concept one will frequently encounter in papers regarding the atmosphere in relation to climate. When the air is dry, this temperature drop is about 10 °C per km. When the air contains water vapor, this vapor will condense to water upon cooling as a result of the rising of the air, which releases heat of condensation. So in this way, heat is transported to higher altitudes and the temperature drop with height will decrease. For air saturated with water vapor, this vertical temperature drop is approximately 6 °C per km.

When the earth gets warmer, air can contain more water vapor. This also has an impact on the lapse rate, since more water vapor means more heat transfer to higher altitudes. This effect on the lapse rate is called the lapse rate feedback. More heat at higher altitudes implies that there will be more emission of infrared light, a negative feedback. This effect is particularly important in the tropics. At higher latitudes, the increase in temperature at the surface is dominant, therefore the change in the lapse rate will turn into a positive feedback. See figure 1 (adapted from the climate dynamics webpage of the University of Leuven).

(more…)