Guest post by Jos Hagelaars. Dutch version is here.

Discussions on the Internet regarding climate change are sometimes about scientific details, sometimes about the climate sensitivity regarding the equilibrium situation hundreds of years from now, but the most prevalent discussion topic is probably: the global average temperature. Will it get warmer or colder, is there a temporary slowdown or acceleration in the rise in temperature, are the models correct or not, will the eventual warming of our earth in the future be large or small? New numbers are released on a monthly basis and every month megabytes of text are generated about them. My forecast is that 2015 again will lead to a discussion-spike.
The graph above shows the evolution of the global surface temperature anomaly for three datasets, where the average of the period 1981-2010 is defined as 0. For the year 2015 only data are presented up to and including June. So far 2015 exceeds all other years and the evolving El Niño makes it likely that 2015 will set a new world record.
The black line in the graph is a so-called smooth function (Loess) over 30 years. 30 years is not an arbitrary choice, it is the number of years on which the climatic definition is based. Natural variability, e.g. caused by El Niño’s and La Niña’s or temporary dips by volcanic eruptions are averaged out on this time scale. This climatically relevant perspective of 30 years shows that there has been a steady increase in the surface temperature on Earth since the 1970s, as expected given the steady rise in greenhouse gas concentrations in the atmosphere.
A comparison between the observations and forecasts of climate models for various scenarios in terms of greenhouse gas emissions is frequently presented on Real Climate by Gavin Schmidt of NASA. Also this year, where he compared various datasets with CMIP3 model calculations (used for IPCC AR4) and CMIP5 model calculations (used for IPCC AR5). The last year that is visible in these comparisons made by Gavin Schmidt is the year 2014. The Real Climate graphs show that the observations clearly fall within the range of the model calculations. So Gavin Schmidt eventually concludes:
By now 2015 is halfway through and – driven by curiosity – I added the data of the first half of this year to the graphs made by Gavin Schmidt. See the green rectangle in the two graphs below. 2015 so far is rather close to the average model (IPCC AR4) for the A1B scenario as predicted in 2000 (figure 2).
The graph in figure 3 contains the CMIP5 calculations for IPCC AR5 and also an update of these calculations. Several years have passed since the CMIP5 calculations for AR5 were made and now there is new information available on e.g. solar activity, volcanic ash in the atmosphere and the concentration of greenhouse gases. An update of the CMIP5 calculations on the basis of this new information is shown as dashed lines in figure 3. The green rectangle representing 2015 is fairly close to the center dashed line.

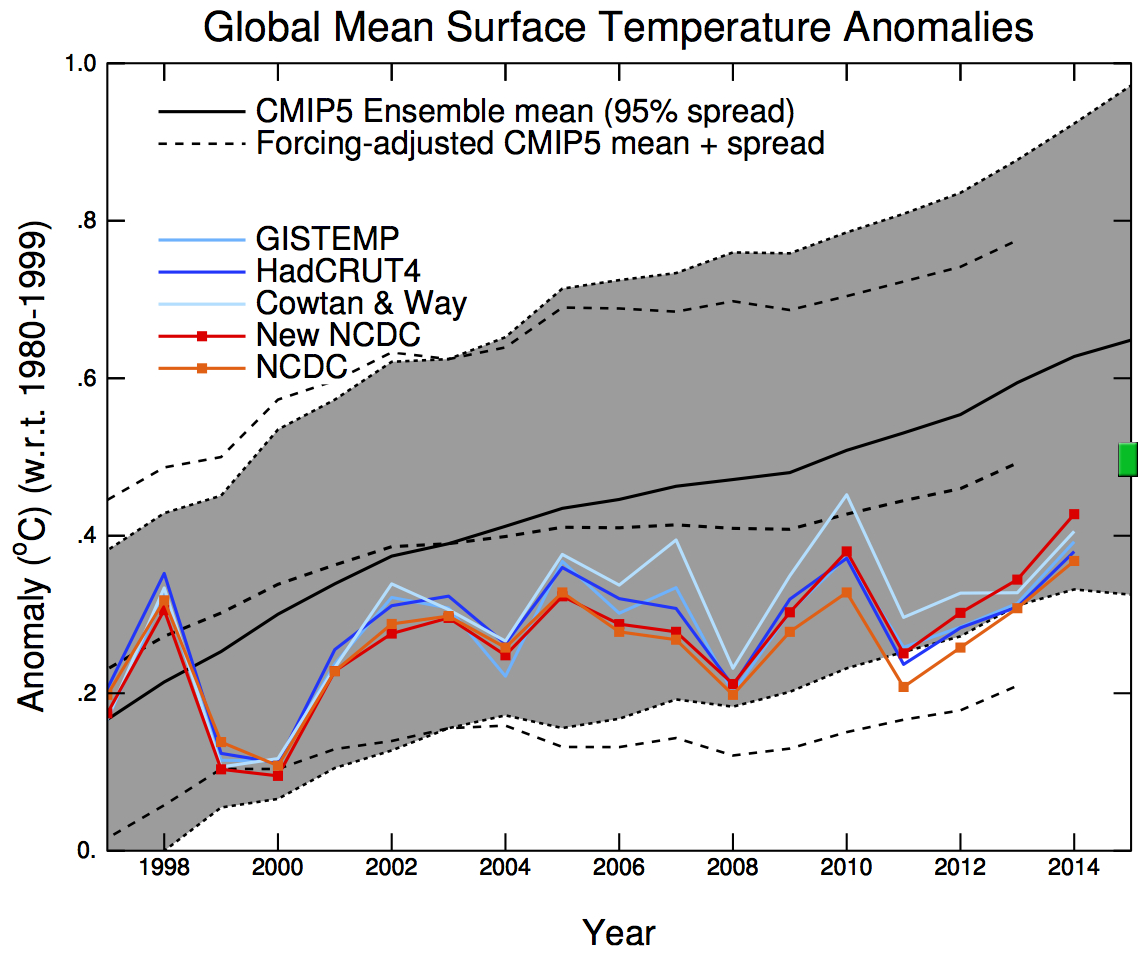
It is important to note that the exact timing of the natural variation is not present in each individual run of a climate model. When you take an average of the different model runs, as shown by the black line in the middle of the gray areas in figures 2 and 3, the influence of natural variation is completely gone. For example, there are no El Niño/La Niña spikes visible in the two black lines. Climate models may thus give an idea of the ‘forced’ development of the climate under different scenarios, but not of the weather-induced or other ‘unforced’ variability.
Besides the misspecification of climate forcings there may be other factors that create the appearance of a divergence between modeled and observed temperatures: The former is based on air temperatures, whereas the latter is based on sea surface temperatures over the oceans.
I am not aware of any climate models developed by the so-called climate skeptics that are based on physics in a way that is similar to the CMIP3 and CMIP5 models. Maybe I missed something? However, I encountered some forecasts in the past and I compared some of these with the observations including May 2015 (HadCRUT4). Two more ’serious’ forecasts are presented in figures 4 and 5. Figure 4 is taken from the book “Die Kalte Sonne” (2012 – English: “The Neglected Sun) written by Fritz Vahrenholt and Sebastian Lüning and Figure 5 is from a paper by Nicola Scafetta (2012). The green and gray lines are HadCRUT4 monthly data that I added to both figures respectively. In both cases the 2015 temperature value is located outside the range of the forecast, just a few years after the forecast was issued.


The funniest forecast is made by Don Easterbrook, an emeritus professor of Geology. He has presented this at a meeting of the Heartland Institute in 2010 and Hans Labohm (a Dutch climate sceptic) used this very seriously in a discussion with Bart Strengers (PBL Netherlands Environmental Assessment Agency) on the website of the Dutch news station NOS in 2009. According to Easterbrook we would get significant global cooling. See figure 6, again the green line consists of the HadCRUT4 monthly data which I placed in the graph of Easterbrook. Even at the time of his presentation in 2010 this forecast could already be seen to be way off.
More information about this silly forecast of the Don can be found at SkepticalScience.

I may think that the forecast made by Easterbrook is funny, sadly there are still a lot of people who take these sorts of wishful thinking type forecasts seriously. Science, however, tells a different and thoroughly substantiated story. It will get warmer this century. How much warmer depends to a great extent on choices we make regarding future emissions.

Tags: 2015, Easterbrook, Fritz Vahrenholt, Gavin Schmidt, global average temperature, Hans Labohm, hiatus, record warm, Scafetta, slowdown, temperature trend

August 8, 2015 at 10:51
Not a word about the satellite record and how it diverges from the IPCC scenarios? Not a word about the ever upward “adjustments” of the GISS and similar datasets?
August 8, 2015 at 13:21
@vuurklip
– “Not a word about the satellite record and how it diverges from the IPCC scenarios?”
Indeed. The original graphs in figures 2 to 7 are about the surface temperatures. The climate model data are about the surface temperatures. The satellite data are not. I prefer a like-for-like comparison, difficult enough if you for instance take a look at Cowtan et al. 2015:
http://www-users.york.ac.uk/~kdc3/papers/robust2015/background.html
Besides that people don’t live at an altitude of about 2 km, where the main weight factor of the satellite data is located, and even up to the stratosphere: the lower troposphere which the satellite data are about.
– “Not a word about the ever upward “adjustments” of the GISS and similar datasets?”
Ever upward? If you look at all corrections it is quite clear that the trend from 1880 without corrections is higher than the trend with corrections.
The recent NCEI “adjustments” are much smaller than the recent UAH “adjustments”. I presume you complained heavily to Christy & Spencer about these huge UAH changes?
(Y-axis: Difference in temperature anomaly, X-axis: Year)
August 8, 2015 at 21:50
@vuurklip One has to remember that CO2 (and other greenhouse gases) acts as a blanket, and mankind is increasing the number of blankets.
Surface temperature are taken at the bottom of the stack of blankets, while the satellite measurements are temperatures in the middle of the stack. Consequently, the latter measurements are somewhat insulated from the full effect of any greenhouse warming.
Indeed, the difference in warming between the surface and the troposphere is a definitive signal for greenhouse gas-warming, and is a source of confusion for people who don’t realize the difference.
August 9, 2015 at 19:30
Perhaps the author would care to correct Dennis’s comment above and perhaps the author would also point out to vuurklip that the CMIP3&5 projected trends in the lower and mid troposphere diverge even more radically from observations.
August 9, 2015 at 20:49
@Jaime Jessop
I think that Dennis is referring to the cooling of the stratosphere due to increasing greenhouse gas concentrations, which is one of the indicators of a human fingerprint on climate change:
http://www.skepticalscience.com/10-Indicators-of-a-Human-Fingerprint-on-Climate-Change.html
I also think that your statement (without any reference) “diverge even more radically” is not correct, at least for the lower troposphere temperatures. Please have a look at figure 1c in:
http://www.nature.com/ngeo/journal/v7/n3/full/ngeo2098.html
August 9, 2015 at 22:25
@Jos Hagelaars
“I think that Dennis is referring to the cooling of the stratosphere due to increasing greenhouse gas concentrations, which is one of the indicators of a human fingerprint on climate change”
I think not. I think he is trying to justify the reduced warming trend recorded by the satellite data (lower/mid troposphere).
The mid troposphere observations (particularly the tropical mid troposphere) diverge very markedly from projected temperatures. Accelerated warming in the tropical mid-troposphere is a feature of the climate models and would be evidence of a ‘human fingerprint’ of global warming. It has so far failed to materialise.
The climate models predict greater warming (relative to the surface) in the lower troposphere also, though not as much as in the tropical ‘hotspot’. As UAH and RSS both show reduced warming trends in the LT relative to the surface datasets, it stands to reason that the models vs. observations for the LT will also show a larger divergence than a comparison of modeled vs. surface temps. As you can see, this is borne out by Christy’s graph:
Can’t see the fig. you refer to but it seems it is the LT trend from 1998 to 2012 (the ‘pause’) with ENSO and volcanic influences removed – not really representative of actual LT trends over the entire satellite era.
August 10, 2015 at 17:28
@Jamie Jessop
– “I think he is trying to justify the reduced warming trend recorded by the satellite data (lower/mid troposphere).”
Well then let’s hope Dennis will clarify his statement.
– “Accelerated warming in the tropical mid-troposphere is a feature of the climate models and would be evidence of a ‘human fingerprint’ of global warming.”
If you are referring to the ‘Tropical hotspot’ please read: http://iopscience.iop.org/1748-9326/10/5/054007/article
– “As you can see, this is borne out by Christy’s graph..”
I am familiar with Christy’s/Spencer’s way of making graphs where a certain message seems to be much more import than sound science: https://ourchangingclimate.wordpress.com/2014/02/22/john-christy-richard-mcnider-roy-spencer-flat-earth-hot-spot-figure-baseline/
(Dutch version: https://klimaatverandering.wordpress.com/2014/02/12/spencers-grafiekengoochelarij/)
– “Can’t see the fig. you refer to but it seems it is the LT trend from 1998 to 2012 (the ‘pause’) with ENSO and volcanic influences removed – not really representative of actual LT trends over the entire satellite era.”
As explained in the post, the climate models (CIMP5) use forcing data up to 2005 so the exact timing of natural variation (e.g. ENSO) is not present in the model results and certainly not in the model run averages. Santer et al. are just trying to compensate for the change in forcing due to volcanoes and for the influence of ENSO variability.
The post is about the surface temperatures but it seems you just want to focus on the satellite data and their lower troposphere (or higher) temperatures. Besides all the complications regarding the satellite data, e.g. correct compensation for satellite drift, instrument biases, how well the cooling stratosphere is filtered out of the data or how well the data of different satellites are joined, the satellite data simply do not refer to the same thing as the surface temperatures. It’s an apples and oranges comparison as becomes clear after reading this post of Geert Jan van Oldenborgh: http://www.climate-lab-book.ac.uk/2014/temperature-lower-troposphere/
“The TLT series looks so similar to the near-surface temperature series only because of a cancellation between the differences in the tropics and the high latitudes.“
Also the satellite data of UAH or RSS have a greater variance than the surface temperature data and therefore one should be much more careful when drawing conclusions from them. Especially on shorter time frames, say a decade or even two.
More on the satellite data in: https://ourchangingclimate.wordpress.com/2013/03/01/klotzbach-revisited/
And I was wondering: do you also have comments on this post regarding the surface temperatures?
August 10, 2015 at 19:07
@Jos Hagelaars,
“The post is about the surface temperatures but it seems you just want to focus on the satellite data and their lower troposphere (or higher) temperatures.”
This post does indeed concern itself with the surface datsets and a comparison with the modeled trends. But the wider context is antrhropogenic global warming. Vuurklip pointed out: “Not a word about the satellite record and how it diverges from the IPCC scenarios?” Your response was that “The climate model data are about the surface temperatures. The satellite data are not.” You might at least have pointed out that climate models don’t just concern themselves with modeling the surface trend and that there is indeed a large discrepancy between GCM projections in the troposphere compared to observations. You might also have conceded the point that temperature trends (on all timescales) in the lower troposphere and at the surface are intimately connected and very highly correlated, even though they might not be ‘the same thing’. So focussing exclusively on the surface temperature record with regard to the wider issue of global warming is bound to be questioned by people who see the data for the lower troposphere and see that it shows no significant warming for nearly 20 years. Arguing that the surface and satellite data are ‘apples and oranges’ in the context of the wider issue of ‘dangerous’ global warming is disingenuous in my opinion, in that much of the ‘dangerous’ amplification of GHG warming is hypothesised to occur precisely in the troposphere via water vapour feedbacks, which then will naturally feed down to the surface. The fact that the troposphere has failed to respond to GHG forcing as expected is cause for debate and – like it or not – it will continue to intrude into any discussions of the warming trend at the surface.
August 10, 2015 at 20:52
@Jaime Jessop
Sorry that I mistyped your first name in my last comment.
– “You might at least have pointed out that climate models don’t just concern themselves with modeling the surface trend and that there is indeed a large discrepancy between GCM projections in the troposphere compared to observations.”
I pointed out that the graphs in the post are about the surface temperatures as you now acknowledge. I also gave you a reference to a peer reviewed article that shows that your statements “diverge even more radically” and “large discrepancy” about the difference between the TLT and climate models are not correct. Do you have scientific references that support your statements?
– “You might also have conceded the point that temperature trends (on all timescales) in the lower troposphere and at the surface are intimately connected and very highly correlated, even though they might not be ‘the same thing’.”
I gave you a reference to a post on this subject in my previous comment. You haven’t read that yet? I also indicated that the variance of the satellite data is much larger than the variance of the surface date, which should make one more cautious in drawing conclusions from the satellite data. Interesting in this respect is this comment of Carl Mears from RSS:
“A similar, but stronger case can be made using surface temperature datasets, which I consider to be more reliable than satellite datasets (they certainly agree with each other better than the various satellite datasets do!).“
http://www.remss.com/blog/recent-slowing-rise-global-temperatures
– “..the data for the lower troposphere and see that it shows no significant warming for nearly 20 years.”
You also have to consider the uncertainty in the trend calculation, which is quite large in the satellite datasets. Therefore again: be cautious in drawing conclusions from the satellite data. Two examples of trends in °C/decade starting from July 1995 with 2-sigma uncertainty (method F&R 2011, autocorrelation from 1979 up to now):
GISTEMP = +0.147 ± 0.081
RSS = +0.029 ± 0.144
Besides: we have other data of the higher parts of the troposphere that dates back to 1958. It clearly shows warming: https://tamino.wordpress.com/2015/06/19/desperate-for-a-pause/
– “Arguing that the surface and satellite data are ‘apples and oranges’ in the context of the wider issue of ‘dangerous’ global warming is disingenuous in my opinion..”
Nice qualification that “disingenuous”, very interesting. Read the post of Geert Jan van Oldenborgh.
– “.. in that much of the ‘dangerous’ amplification of GHG warming is hypothesised to occur precisely in the troposphere via water vapour feedbacks, which then will naturally feed down to the surface.”
It is more than a hypothesis, it is a theory. Ever heard of Clausius–Clapeyron? And I still recommend that you read: http://iopscience.iop.org/1748-9326/10/5/054007/article
Besides, there are other indicators for global warming, e.g.: sea level rise, melting of the large ice sheets or the increase of the ocean heat content.
– “The fact that the troposphere has failed to respond to GHG forcing as expected is cause for debate..”
Warming since the 1970’s, as Tamino wrote:
“It’s clearly upward, in fact it’s going faster than the surface temperature data.”
August 10, 2015 at 21:05
Although Jos has already pointed out that one should be careful of making strong statements with respect to the satellite measurements, there is one issue to bear in mind. If the troposphere is warming more slowly than models suggest, then that would suggest that lapse rate feedback is less negative than we expect and that surface warming should – on sufficiently long timescales – be faster than expected, unless there is some other negative feedback about which we’re currently unaware.
August 10, 2015 at 23:29
“Sorry that I mistyped your first name in my last comment.”
No problem.
“I also gave you a reference to a peer reviewed article that shows that your statements “diverge even more radically” and “large discrepancy” about the difference between the TLT and climate models are not correct. Do you have scientific references that support your statements?”
It doesn’t work like that, I’m afraid. One peer-reviewed paper that re-analyses one particular radiosonde datset using kriging and multiple linear regression to ‘prove’ that the tropospheric tropical hotspot exists doesn’t disprove my comments. It brings them into question, sure, but then you have to consider the considerable body of observational evidence and peer reviewed literature which suggests strongly that the hotspot is indeed missing. I don’t believe I need to point you in the direction of any particular paper as there are several quite well known on the issue. In my opinion, the evidence ‘against’ is rather more convincing than the evidence ‘for’. In any case, the issue is highly contentious and will not be settled by just one peer reviewed paper.
As you quote Carl Mears, let me also quote him on the subject of whether there is, or is not, a tropospheric hotspot and how well the observations in the troposphere match the models:
“Looking at Fig. 2., it is obvious that the observed trends in both temperature datasets are at the extreme low end of the model predictions. This problem has grown over time as the length of the measured data grows. (As the comparison time period gets longer, the uncertainty in linear trends both the measured and modeled time series decreases simply because of the longer time period.) . . . . . . . Conclusion: Taken as a whole, the errors in the measured tropospheric data are too great to either prove or disprove the existence of the tropospheric hotspot. . . . . .
I think all three of us agree that the observed temperature changes in the tropics (and globally) are less than predicted over the last 35 years.”
http://www.climatedialogue.org/the-missing-tropical-hot-spot/
Conceding that a tropospheric hotspot is not specifically a feature of AGW and is more generally related to the MALR in the tropics in response to surface warming, it is still a prominent feature of the GCMs in response to forced GHG warming and it has thus far not been reliably observed. So something is amiss, whether it be a basic misunderstanding of the physics of global warming or a lack of reliable data in the troposphere or indeed at the surface. I think it is entirely possible that the climate models have failed to characterise the nature of global warming (via any forcing, natural or anthropogenic).
August 11, 2015 at 17:04
@Jaime Jessop
– “In my opinion, the evidence ‘against’ is rather more convincing than the evidence ‘for’. In any case, the issue is highly contentious and will not be settled by just one peer reviewed paper.”
The sentence from me that you quoted was about Santer et al 2014 with respect to your incorrect statements about the TLT temperatures. Not about the tropical hotspot.
– “So something is amiss, whether it be a basic misunderstanding of the physics of global warming or a lack of reliable data in the troposphere or indeed at the surface.”
Measurements at that altitude have a large uncertainty and it is hard to prove the existence of the tropical hotspot as well as to prove it doesn’t exist. The latest papers, like the one from Sherwood & Nishant, suggest the hotspot is there.
As ATTP also mentioned, no hotspot would suggest that the lapse rate feedback is less negative than expected and therefore the climate sensitivity would be higher than the models indicate.
August 11, 2015 at 18:01
Jos,
“The sentence from me that you quoted was about Santer et al 2014 with respect to your incorrect statements about the TLT temperatures. Not about the tropical hotspot.”
Yes, you are correct, wrong paper. I apologise. However, the principle remains the same. You presented me with a paper that suggested a POSSIBLE reason for lower tropospheric temp increases only since 1998, amounting to a reduction in the difference bewteen observed and modeled trend of “up to” 15%, with “large uncertainties” in the actual magnitude. Given that the modelled TLT trend relative to the surface is 1.2 and the observed is about 0.8, a 15% decrease on the difference (0.4) is only 0.06 – which still leaves us far short and only covers the period from 1998.
“As ATTP also mentioned, no hotspot would suggest that the lapse rate feedback is less negative than expected and therefore the climate sensitivity would be higher than the models indicate.”
I’m not really knowledgeable enough to comment with any conviction on this rather complex subject, but Sherwood says:
“Let us suppose for the moment that the “hot spot” really has been missing while the surface has warmed. What would the implications be? . . . . .
The implications for climate sensitivity are also roughly nil. The total feedback from water vapour and lapse-rate changes depends only on the changes in relative humidity in the upper troposphere, not on the lapse rate itself (see Ingram, 2013).”
http://www.climatedialogue.org/the-missing-tropical-hot-spot/
August 11, 2015 at 18:41
@Jaime
– “You presented me with a paper that suggested a POSSIBLE reason for lower tropospheric temp increases only since 1998, amounting to a reduction in the difference bewteen observed and modeled trend of “up to” 15%, with “large uncertainties” in the actual magnitude”
No. You made the following statements about the difference between the TLT (as represented by the satellite data) and climate models: “diverge even more radically”, “large discrepancy”. In my opinion the paper of Santer et al. 2014 shows that the data from RSS are within uncertainty range of the model runs and yes after the 2000’s they are on the lower side.
About Sherwood’s remark on ClimateDialogue: He is referring to the fact that in the climate models the combination of the lapse rate feedback and water vapour feedback is roughly constant. I was referring to the fact that when you only increase the lapse rate feedback (= make it less negative), the climate sensitivity should go up. For Dutch readers, this is also mentioned on: http://www.klimaatportaal.nl/pro1/general/start.asp?i=0&j=0&k=0&p=0&itemid=967
This discussion is becoming off topic and I think it will not get us any further.
This post is about the surface temperatures and the comparison of these measurements with CMIP3/CMIP5 data and some ‘sceptic forecasts’. Do you have any comments about that?
August 11, 2015 at 20:12
I think the point that Sherwood is making (which – to be fair – I hadn’t realised) is that if there is a missing hot-spot then it could imply a reduced water vapour feedback (less positive) and a reduce lapse rate feedback (less negative) and so the net effect would be small/nil.
August 11, 2015 at 20:51
I’m not very familiar with past predictions of cooling, many of which it seems were probably quite amateurish efforts, which is perhaps not surprising given the huge emphasis on global warming research. Given the vast resources available to investigate INCREASES in global temperature, it IS rather surprising that, over the past 15-20 years, mainstream climate science has got it so wrong.
Global cooling predictions/studies are becoming more sophisticated and better funded and consequently are impoving in terms of the quality of the research involved. Most predict fairly significant global cooling within the next 30 years – some saying global cooling is ‘imminent’ – 2015/16/17 onwards. We won’t have to wait too long to see how accurate they are! Here is one interesting study:
Click to access esdd-6-1237-2015.pdf
Many more have been published in recent years. Links available here:
Global cooling projections have definitely moved on and I don’t think in five years time that there will be too many people poking fun at them on blogs. I could be wrong. The predicted ‘monster’ El Nino of 2015/16 may have, by then, initiated another round of very rapid warming, but I doubt it personally.
August 11, 2015 at 20:59
Jaime,
Can you point to a single, physically-motivated model that predicts global cooling within the next 30 years if we continue to increase our emissions? I don’t think you can. I think all you can do is point to studies suggesting a reduction in solar activity and then inferring cooling based on some kind of correllation between solar activity and temperature. Given that we expect there to be such a correllation even in the presence of other forcings, this is not really evidence for global cooling in the next 30 years.
August 11, 2015 at 23:57
@aTTP
Natural climate variability studies and anthropogenic studies have evolved in very different ways and I think it’s a bit unfair to expect studies of global cooling (based upon solar variability/internal variability) to conform to the standards set by papers examining the influence of GHGs upon climate and the CMIP3/5 climate models.. GHG warming theory started off as basic 19th century physics which was embellished with the development of very sophisticated GCMs incorporating basic radiative physics and classical thermodynamics, combined with (simplified) global circulation modelling. These climate models have become increasingly complex and have allowed for progressively finer resolution as computing power has increased.
The study of solar variability and its (possibe) influence upon climate has proceeded in a very different fashion, stimulated initially, yes, by the observation of an apparent correlation with solar activity (initial proxy – sunspot number) and regional and global temperatures. But it’s not just an exercise in trying to refine that correlation and thereby ‘prove’ that solar activity drives climate, with some estimation of how much it drives climate. There are numerous physical studies which attempt to identify the mechanisms whereby solar activity can affect climate. There are also numerous studies which DO attempt to clarify the causative link between solar activity – as measured by various proxies – and global climate (not just temperatures, but circulation patterns). Many of them do not attempt an explanation of the physical mechanism(s) which might be involved. Other papers concern themselves exclusively with investiagtion of the physical mechanisms involved. So it’s a whole different ball game for the natural climate investigators. And generally, they do not concern themselves with predictions of what may or may not happen due to anthropogenic forcings; they base their estimates of climate variability (often future cooling) upon natural influences only, which may (or may not) be overridden by anthropogenic warming.
As regards internal variability and its influence upon climate, a lot of that research has been driven by the perceived need to explain why global temperatures have not risen by quite as much as they were expected to!
August 12, 2015 at 00:23
– “Given the vast resources available to investigate INCREASES in global temperature, it IS rather surprising that, over the past 15-20 years, mainstream climate science has got it so wrong.”
“so wrong”: Maybe have another look at the graphs 2-3 in this post.
– “Global cooling predictions/studies are becoming more sophisticated and better funded and consequently are impoving in terms of the quality of the research involved.”
Sure, global cooling will be our fate because of a decrease in solar activity and CO2 stops absorbing IR.
– “I think it’s a bit unfair to expect studies of global cooling (based upon solar variability/internal variability) to conform to the standards set by papers”
I think they should conform to science and the laws of physics.
– “The study of solar variability and its (possibe) influence upon climate has proceeded in a very different fashion, stimulated initially, yes, by the observation of an apparent correlation with solar activity (initial proxy – sunspot number) and regional and global temperatures.”
About that correlation over 1880 – 2014 (year data):
TSI vs T is about 0.34
CO2 vs T is about 0.92
Maybe you can explain why the solar activity shows no trend (slight decrease) since the 1950’s and why temperature has risen, why sea level has risen and why the ocean heat content has increased? Can you explain why the correlation between TSI and T over 1880-2014 is low and the correlation between CO2 and T over the same period is high? Can you explain these graphs below? Climate science can.
August 12, 2015 at 08:17
Jaime,
I take it the answer is “no”?
August 12, 2015 at 15:58
@aTTP
You can take it any way you wish but I would suggest a rather more strict interpretation of my reply based upon the actual words used.
@Jos
Re. correlations of solar activity vs. CO2 with global temperatures:
Finally, Arctic wide surface air temp anomalies vs. CO2 and TSI. Not global, but the Arctic is supposed to be THE place that responds most sensitively to GHG forcing.
All in all, the evidence for a high correlation of CO2 and temperature since 1850 looks rather less convincing than your deceptive graph above shows and the evidence for a close correlation between solar activity and global temperature from 1850 to at least the end of the milennium looks rather more convincing than you portray.
August 12, 2015 at 17:03
Jaime,
Okay,
This isn’t how science works. You don’t really get to argue that your idea is newer than someone else’s and that that should excuse your lack of a physical model. If you want to convince people, you develop that model.
Is your bottom figure above an integration of sunspots, or something like that?
August 12, 2015 at 18:00
All I’m trying to point out is that you can’t expect papers by a relatively small number of independent researchers building upon a relatively novel area of investigation to follow the same pattern as the thousands of papers on AGW released over the years. Consensus climate science has developed via a lavishly funded, huge international collaborative effort coordinated via the United Nations IPCC and principally involving the development of a large ensemble of very sophisticated climate models. There are bound to be big differences in presentation and in ease of access to resources, both financial and intellectual. Of course such papers should conform to the standards set by current scientific research and, as most such papers are peer-reviewed, it can hardly be argued that they do not. You seem to think that global cooling/solar influence research should involve the development of a model or models, but I don’t think this is necessary for good science. After all, climate science, before it became almost exclusively the domain of highly sophisticated computer modeling techniques, was once a largely empirical science and Hubert Lamb, the foremost representative of that empirical approach to climate studies, remained unimpressed by the newer modeling techniques emerging in his day.
August 12, 2015 at 21:03
Jaime,
I understand what you’re suggesting, but I think the argument you’re making isn’t compelling. There are many reasons why some ideas are only studied by a small group of people, and largely ignored by the rest. The most likely is that others have considered these ideas, found them lacking, and decided it’s not worth pursuing them further. That doesn’t mean that they won’t turn out to have some merit, but it is extremely unlikely.
August 12, 2015 at 22:05
@Jaime Jessop
First your reference to Sánchez-Sesma. He clearly states that this “..cooling of 0.5 °C for the rest of the 21st century”, due to a possible new “Grand (Super) Minimum”, is “..without taking into account volcanic and anthropogenic forcing”. The area is limited to the continental tropical climate, so only land area, he also claims to use a ‘simple model’. There are studies that investigate the influence of a relative large decrease in energy output of the sun but also take into account the future increase of anthropogenic forcings: “This offsets or delays the global warming trend by ~2 years and is small compared with the modelled global warming.”
http://www.nature.com/ncomms/2015/150623/ncomms8535/abs/ncomms8535.html
About your graphs, they are just taken from the ‘sceptical’ blogosphere, which are being recycled and presented over and over again. Something that is very recyclable is considered to be ‘green’ here in Holland :).
The first graph is from Beer et al. 2000 (figure 8):
http://www.sciencedirect.com/science/article/pii/S0277379199000724
It’s no secret that the energy output of the sun has an influence on climate. However, by now the increase in anthropogenic forcing is much larger than the changes in solar forcing. Something that was already mentioned in Beer et al.:
“The separation [the anthropogenic component from a solar forcing component] shows that the anthropogenic forcing component is steadily growing.”
The temperatures in figure 8 from Beer 2000 are two datasets combined and ending in 1984. The temperature rise since 1984 is about 0.5 °C, about 1/3 of the scale of that graph.
The second graph is probably based on Friis-Christensen 1991. More about that one on SkepticalScience: http://www.skepticalscience.com/solar-cycle-length.htm
From Benestad 2005: “There have been speculations about an association between the solar cycle length and Earth’s climate, however, the solar cycle length analysis does not follow Earth’s global mean surface temperature.”
The third graph from Jonova is roughly the same as the second graph in my previous comment.
More about earlier warming periods again on SkepticalScience:
“Statistical analysis of the rate of warming over different periods find that warming from 1970 to 2001 is greater than the warming from both 1860 to 1880 and 1910 to 1940.”
The fourth graph is a sort of zooming in on the second graph in my previous comment, with some extra trend lines drawn. You could calculate the correlation between the datasets as I did in my previous comment (again year-data), but now from 1950 – 2014:
TSI vs T is about -0.08
CO2 vs T is about 0.93
The correlation between the energy output from the sun and the temperature since 1950 is absent.
The two bottom graphs are generated by Willie Soon:
http://onlinelibrary.wiley.com/doi/10.1029/2005GL023429/abstract (figure 1).
He used the Hoyt & Schatten TSI reconstruction which dates back from 1993. That reconstruction was already obsolete when Soon wrote his paper. And even your fellow ‘sceptics’ consider that reconstruction to be outdated: “Unfortunately, the Hoyt TSI data is obsolete.”
http://bobtisdale.blogspot.nl/2009/01/agw-proponents-are-two-faced-when-it.html
– “All in all, the evidence for a high correlation of CO2 and temperature since 1850 looks rather less convincing than your deceptive graph above shows and the evidence for a close correlation between solar activity and global temperature from 1850 to at least the end of the milennium looks rather more convincing than you portray.”
Again a nice qualification: ‘deceptive’. O, and I’ve read your other nice qualifications about me on the BBC website. Typical.
There is nothing ‘deceptive’ about these graphs. You can check the data yourself and calculate the correlations. I assume you can find the GISTEMP/NCEI/HadCRUT data. The TSI data are from: http://lasp.colorado.edu/home/sorce/data/tsi-data/
and the CO2 data are from:
ftp://aftp.cmdl.noaa.gov/products/trends/co2/co2_annmean_gl.txt
http://www.pik-potsdam.de/~mmalte/rcps/ (Historical)
– “..a relatively novel area of investigation..”
No not quite. According to professor Joanna Haigh, known for her work on solar variability, this ‘relatively novel area’ dates back to 1795. Way before Fourier and Tyndall:
“The idea that variation in solar activity may affect the climate has been discussed as early as 1795, when Herschel proposed such a possibility”.
http://www.sciencemag.org/content/272/5264/981
Jaime, nobody denies that the sun has an influence on climate as well as e.g. volcanoes or aerosols and nobody denies the existence of natural variation. But due to our GHG emissions the main driver of the climate since the 1950’s are we humans. When we continue on this path humans will also be the main driver of the future climate. With or without a new ‘Grand Minimum’.
August 13, 2015 at 01:20
@Jos
As I have already said, these studies generally take no account of any projected warming due to GHG forcing; they merely suggest that we should expect a cooling influence from natural causes, in addition to suggesting that natural causes may have contributed significantly to the warming we have seen since 1850. Temperatures have risen 0.8C since 1850, about 0.5C since 1950. The IPCC says that it is extremely likely that all of that increase since 1950 is anthropogenic, but that assessment, based on model runs and attribution studies, is looking increasingy unsound.
With reference to my graphs, you say:
“The second graph is probably based on Friis-Christensen 1991. More about that one on SkepticalScience:” http://www.skepticalscience.com/solar-cycle-length.htm
John Cook, the author of that link says:
“Claims that solar cycle length prove the sun is causing global warming are based on a single paper [later rebutted supposedly] published nearly 20 years ago.”
Apparently, this page has not been updated since June 2010 and in August 2015, you see fit to reference this page in order to refute that there is any link between solar cycle length and global temperatures/climate change.
“Relations between the length of a sunspot cycle and the average temperature in the same and the next cycle are calculated for a number of meteorological stations in Norway and in the North Atlantic region. No significant trend is found between the length of a cycle and the average temperature in the same cycle, but a significant negative trend is found between the length of a cycle and the temperature in the next cycle. . . . .
We find for the Norwegian local stations investigated that 25–56% of the temperature increase the last 150 years may be attributed to the Sun. For 3 North Atlantic stations we get 63–72% solar contribution. This points to the Atlantic currents as reinforcing a solar signal. . . .
► A longer solar cycle predicts lower temperatures during the next cycle. ► A 1 °C or more temperature drop is predicted 2009–2020 for certain locations. ► Solar activity may have contributed 40% or more to the last century temperature increase. ► A lag of 11 years gives maximum correlation between solar cycle length and temperature . . . . .
Based on strong correlation between the production rate of the cosmogenic nucleids 14C and 10Be and proxies for sea ice drift, Bond et al. (2001) concluded that extremely weak perturbations in the Sun’s energy output on decadal to millennial timescales generate a strong climate response in the North Atlantic deep water (NADW). This affects the global thermohaline circulation and the global climate. . . . .
Significant linear relations are found between the average air temperature in a solar cycle and the length of the previous solar cycle (PSCL) for 12 out of 13 meteorological stations in Norway and in the North Atlantic . . .
For the average temperatures of Norway and the 60 European stations, the solar contribution to the temperature variations in the period investigated is of the order 40%. An even higher contribution (63–72%) is found for stations at Faroe Islands, Iceland and Svalbard. This is higher than the 7% attributed to the Sun for the global temperature rise in AR4 (IPCC, 2007). About 50% of the HadCRUT3N temperature variations since 1850 may be attributed solar activity. However, this conclusion is more uncertain because of the strong autocorrelations found in the residuals.”
http://www.sciencedirect.com/science/article/pii/S1364682612000417
“Thus we find that the recently reported retreat of the ice in the Greenland Sea may be related to the termination of the so-called Little Ice Age in the early twentieth century. We also look at the approximately 80 year variability of the Koch [sea ice] index and compare it to the similar periodicity found in the solar cycle length, which is a measure of solar activity. A close correlation (R=0.67) of high significance (0.5 % probability of a chance occurrence) is found between the two patterns, suggesting a link from solar activity to the Arctic Ocean climate.”
http://www.researchgate.net/publication/252045260_Multi-decadal_variation_of_the_East_Greenland_Sea-Ice_Extent_AD_1500-2000
So, you see, there is more recent research which links SCL to climatic variability in the NH and very likely to global temperatures, given that further research finds a significant drop in temperatures globally during the Maunder Minimum.
Your dismissal of my graphs is duly noted and in the case above not accepted. You also say very little about the fact that CO2 increases do not correlate at all well with significant periods of warming and cooling during the last 150 years. You seem to be rather resentful that I have challenged you here and elsewhere on your – in my opinion, unduly biased – conviction that science tells us that the world will continue to warm. Your apparently scientifically grounded and quite detailed responses to my attempts to provide evidence that solar activity significantly affects our climate is also noted in contrast to you not commenting at all on Dennis’s mistaken attempt at accounting for a lack of warming in the troposphere.
You – and many others – may be right in thinking that CO2 will continue to warm the planet. Personally I doubt that any future warming will be ‘dangerous’ given the current low estimates of climate sensitivity. I think you – and many others – are very wrong in dismissing the potential impact of declining solar activity upon NH temperatures especially within the next decade or two. The consequences of getting this wrong are dire indeed if AGW doesn’t very quickly compensate for the expected decline.
Thank you anyway for entertaining my critical comments on your blog post. I shall discontinue to comment now as I think we have exhausted the usefulness of the conversation. We shouldn’t have to wait too long to see whose opinion on near future global temperatures is correct.
August 13, 2015 at 13:14
“The climate model data are about the surface temperatures. The satellite data are not. I prefer a like-for-like comparison, difficult enough if you for instance take a look at Cowtan et al. 2015:”
I think a more careful review of Cowtan et al 2015 by the author is in order. In particular, I would suggest that the model layer thickness in the comparisons be considered. SST is, according to hadley anyway, very nearly identical to the near surface atmospheric temperature which is why it is in fact USED instead of the near surface atmospheric temperature. Model near surface air and water temperature are both of thicker layers, whereas the ocean will predictably exhibit cooler trends over a thicker layer than near surface and air would exhibit warmer trends near surface than in a thicker layer.
Models stunk that one up too. Besides the authors uncritical acceptance of a “cowtan better-than-we-thought” article, there are a number of papers which demonstrate model bias through the ocean and atmosphere at all layers. Some agreeing better than others of course.
August 13, 2015 at 19:33
@Jaime Jessop
– “You seem to be rather resentful that I have challenged you here..”
No, I just think it’s typical that you feel the need to describe me with words like e.g. “dishonest” or “deceptive”. But it doesn’t bother me and I think it says more about you than me. So no, I’m not resentful that you ‘challenged’ me here. Sometimes a little cynical, because I have been confronted with these kind of ‘arguments’ and graphs so many times.
Thanks for commenting here Jaime.
By the way, it sounds quite alarmist this believe in CGC, Catastrophic Global Cooling :).
@Jeff Id
– “Besides the authors uncritical acceptance of a “cowtan better-than-we-thought” article”
The author’s first name is Jos and the graphs in the post are based upon the public available surface temperature datasets. To my knowledge these are not corrected for the bias recently described in Cowtan et al. 2015.
August 13, 2015 at 20:01
@Jos,
Just briefly, I did not accuse you of being deceptive, I only described the graph you showed as deceptive.
“By the way, it sounds quite alarmist this believe in CGC, Catastrophic Global Cooling :)”
When I mentioned dire consequences, I was mainly referring to our general ill-preparedness to cope with an extended period of cooling, especially a run of much harsher winters; mainly on account of policy-makers’ exclusive focus upon the complete opposite, i.e. global warming. With energy prices being driven ever higher by the cost of subsidising renewables/phasing out cheaper fossil fuel alternatives and energy infrastructure being rendered vulnerable during periods of high demand coupled with low windspeeds, extreme cold winters could cause chaos and high death rates among the poor, the vulnerable and the elderly.
August 16, 2015 at 16:58
Well Jos,
The bias is real but the change in comparison is also biased, perhaps substantially more. If you were to read the paper with a more critical eye, you might find apples are being compared to peaches. In addition to that little problem, it also contains a huge overreach in the same helpful direction by using Gavin’s any-factor-but-CO2-sensitivity “work” to bring model trends closer. However, I do understand that when models are not matching observation, panic might ensue. I wonder when the team will finally investigate whether CO2 sensitivity might be a tweak high!
August 16, 2015 at 18:04
Jeff,
– “In addition to that little problem, it also contains a huge overreach in the same helpful direction by using Gavin’s any-factor-but-CO2-sensitivity “work” to bring model trends closer.”
Cowtan et al 2015 is an interesting paper, but as said before: the graphs in this post are based on the public global temperature datasets.
It is also quite clear that the climate forcings after 2005 are lower than the forcings in the RCP scenario’s that were used for the model forecasts. See for instance the references in:
http://www.nature.com/ngeo/journal/v7/n3/full/ngeo2105.html
– “However, I do understand that when models are not matching observation, panic might ensue.”
Panic is a song of The Smiths, but is in my opinion not applicable to science. When previous model forecasts do not match observations, science needs to find out why. This is exactly what the scientists did. Another example:
http://www.nature.com/ngeo/journal/v7/n9/full/ngeo2228.html
– “I wonder when the team will finally investigate whether CO2 sensitivity might be a tweak high!”
To which ‘team’ are you referring?
Maybe I misinterpret this because I’m Dutch, but nothing is ‘tweaked’ regarding the sensitivity in the models, climate sensitivity is not a parameter in the CIMP5 models. The sensitivity of the climate for a doubling of the CO2 concentration has been investigated and will be investigated further. To our best knowledge ECS is between 1.5 and 4.5. Interesting for the long term, but not for the few decades after the year 2000.
August 17, 2015 at 10:07
“This is exactly what the scientists did. ”
No, the paper you referenced in your post exchanged one bias for another, ignored the multi-level atmospheric studies which also falsify models and claimed better agreement. The whole thing quite thoroughly ignores the fact that better agreement of a single parameter does not mean – more correct.
Throwing a new paper at the discussion to defend comments about the one I am pointing out is hardly helpful. Papers take a long time to internalize, I’ve spent several days on the one in this discussion.
—
So finally, since we are just meeting, the team refers in this case to general climate modeling groups as they ALL are faced with the same problem now. Fixing the models — while many of course deny there was any problem in the first place.
At least we seem to agree that the models need to be fixed.
While I’m no expert, I have read too many modeling papers because I like math and I am quite thoroughly aware of how climate models are constructed, parametrized and are what amounts to being manually tuned mufti-variate curve fits. Cloud feedback might be a great place to look if you’re not sure where adjustments should be done. The cloud, aerosol (unknowenty – which is quite different from uncertainty) bugger the whole process. I would also suggest that ocean heat migration is a serious problem with modeling. What I’ve read on land heat transfer doesn’t seem to represent the heat capacity of rock in the hydrological cycle well either, but I’ve not gotten deep enough into it to satisfy myself one way or the other.
Bottom line —
There is no realistic possibility that ECS is even somewhat close to 4.5 – and that is what really bothers me about this horrifically biased field. No scientist can rationally believe that number at this point yet the IPCC can still publish it as though it were state of the art and people can repeat it as though they ‘know something’.
What I brought up though was a paper in your post which suggested that they have better agreement by comparing apples to apples, and on the surface it sounded reasonable to me. On review, it exchanges one bias for another in the opposite direction, inserts a thoroughly un-vetted correction factor for aerosols and claims victory even though the model STILL does not match the data.
August 17, 2015 at 17:07
@Jef Id
– “No, the paper you referenced in your post exchanged one bias for another…”
For the third time now: Cowtan et al. 2015 is mentioned in the post but the public temperature datasets do not compensate for its findings.
– “At least we seem to agree that the models need to be fixed.”
– “…even though the model STILL does not match the data.”
No we do not agree regarding the models. I never wrote that the models need to be fixed, I wrote that the forcings as used in the RCP scenarios for the years following 2005 differ from reality. Try to read the paragraphs surrounding graphs 2/3.
– “There is no realistic possibility that ECS is even somewhat close to 4.5..”
IPCC AR5 states it’s somewhere between 1.5 and 4.5, if you can’t live with that and think you know better: write your own paper and have it published.
August 17, 2015 at 21:04
Jos,
“write your own paper and have it published.”
I think Curry and Lewis have done a fine job with that.
I went through that exercise on the Antarctic with Eric Steig, it was a huge amount of time to correct what should have been noticed and corrected by the authors. Even after the correction, his work is still cited alongside ours in AR5.
What is the point in working on proving that models run that hot when it is so blindingly obvious?
Like Lewis and Curry, it wouldn’t convince the true believers anyway.
August 18, 2015 at 15:48
“How much warmer depends to a great extent on choices we make regarding future emissions.”
Well we disagree on this point too. Not because less CO2 would create less warming, but rather because it quite clearly doesn’t create the predicted warming of climate models, so the effect is more moderate and secondly because you aren’t going to be able to regulate away human consumption. In fact, the economic suppression effects of your IPCC left-wing regulation will likely result in an increase in emission over what would have naturally occurred.
August 18, 2015 at 16:35
– “What is the point in working on proving that models run that hot when it is so blindingly obvious?”
See the links to Schmidt et al and Knutti et al. It is clearly not obvious.
– “…the economic suppression effects of your IPCC left-wing regulation..”
Talking about biases.
Greenhouse gas molecules are not ‘left-wing’ or ‘right-wing’ or whatever kind of political wing you come up with. They just absorb IR. And the IPCC is not mine.
August 18, 2015 at 19:32
What a silly reply. You need to read more carefully. Regulations are not gas molecules and Schmidt’s paper wouldn’t even exist if models didn’t need fixing.
August 18, 2015 at 20:17
– “What a silly reply.”
Well, I was thinking exactly the same about your reply’s.
– “You need to read more carefully.”
It was very clear what you wrote: You seem to let your political views influence your view on climate science, with your ‘left-wing’ remark. I didn’t discuss politics and will not do so in the future.
– “…Schmidt’s paper wouldn’t even exist if models didn’t need fixing.”
About reading carefully: As I wrote before, the real climate forcings after 2005 differ from the scenario’s and then there’s also the natural variation factor. Schmidt’s and Knutti’s paper explains this, and it is described in the post. There’s no need to ‘fix’ anything. Improve yes, models can always be improved.
You mentioned Lewis/Curry. Their low climate sensitivity of about 1.64 (range 1.05 – 4.05 °K) and the ~8.4 W/m extra forcing in 2100 (RCP8.5 scenario, which we are tracking now) will eventually lead to a warming of ~3.7 °C (range 2.2 – 9.1 °C!!). So 50% chance it will eventually get 3.7 to 9 °C warmer than pre-industrial. Therefore Lewis/Curry provide enough reason for me to think it is very wise to bring down our carbon emissions. And of course there are studies pointing to higher climate sensitivities than the Lewis/Curry study, whether you like it or not.
And do not forget the ocean acidification: More CO2 will bring down carbonate ion concentration in the oceans, simple chemistry and not without consequences for life in the oceans. Another reason to bring down carbon emissions.
August 18, 2015 at 20:40
“You seem to let your political views influence your view on climate science, with your ‘left-wing’ remark.” – that is completely unfair jos. I referred to regulations in that statement but if it helps you sleep better, you can let it stand.
” There’s no need to ‘fix’ anything. Improve yes, models can always be improved.” – Pedantic but I accept.
” Therefore Lewis/Curry provide enough reason for me to think it is very wise to bring down our carbon emissions.” — See you let your views move into “solution land” as well. Does it affect your science? I think the reduce CO2 crowd dramatically overestimates the problems warming causes and underestimates market damage. If you want cheap clean energy, deregulate and watch technology for the next 50 years when there is enough industry and money to replace the whole thing. The left side of this discussion has very little understanding about technology, resources and how they interact with the free market.
The ECS factor from Lewis and Curry and the IPCC are all questionable. Lewis spent considerable time pointing that out. We don’t have long enough data records to know the final stabilizing point, I suggest you stick with TCS and not project unreasonably far into the future when considering which coal plant to shut down. You don’t know any better than anyone else what the weather will be in 100 years. As I wrote before, the effects of oceanic heat capacity are poorly understood. In fact, all of global warming energy can be placed right into the deep oceans with very little effect on water temperature. Nowhere near enough change to prevent the next ice age.
August 19, 2015 at 15:33
Jeff Id:
Sorry Jeff, you made your own bias clear with your careless remarks about “IPCC left-wing regulation” and “market damage”. How do you know that your fear that you’ll have to pay more for your comfort and convenience, from which arise both your unwillingness to acknowledge externality and your sinistrophobia, haven’t affected your science?
“The first rule [of science] is you must not fool yourself, and you are the easiest person to fool.” (Feynman, who else?) The lopsided consensus of working climate scientists comprises political conservatives, liberals and moderates, along with many who don’t give a rodent’s posterior about politics. As individuals, some may allow their politics to bias their scientific judgement, but that’s what peer review is for — to keep individual scientists from fooling themselves. Sure, it’s possible you’re right and the consensus is wrong, but you won’t persuade trained, disciplined scientists with the argument from consequences. Your own words reveal that you’re not even trying not to fool yourself.
August 19, 2015 at 18:29
@Jeff Id
– “Pedantic but I accept.”
Not pedantic, there’s a big difference between your opinion regarding climate models and mine. The word ‘fix’ and your other text regarding the models looks to me like that you seem to think there are several things fundamentally wrong with the models. I disagree, I as made clear. But any model, also climate models, can be ‘improved’: e.g. higher resolutions or better physical description of ice sheet flow. So to me ‘fix’ and ‘improve’ represent a total different view regarding climate models.
– “See you let your views move into “solution land” as well.”
No, it’s just a logical conclusion from all the science (fig. 7 in the post) or even the calculations of Lewis: We need to reduce CO2 emissions. Not only to mitigate the warming to come but also to mitigate the unprecedented ocean acidification ( now faster than in any other period in the last 300 million years), which you didn’t mention in your reply. Your ‘solution land’ is about how to reduce and I don’t know what solution(s) is (are) best.
– “I think the reduce CO2 crowd dramatically overestimates the problems warming causes and underestimates market damage.”
The ‘CO2 crowd’: another negative connotation?
And what if you are wrong and the science – represented by the IPCC – is right about the problems future warming will cause?
– The left side of this discussion…”
There you go again.
– “The ECS factor from Lewis and Curry and the IPCC are all questionable.”
You will never get 100% certainty. The best knowledge we now have is ECS = 1.5 to 4.5.
Also, the best knowledge we now have, the broad assessment of the IPCC, indicates that our current path (RCP8.5) will give us 2.6 – 4.8 °C warming in 2100 and an unprecedented rate of ocean acidification. Because the world won’t stop turning in 2100 this will continue the centuries thereafter.
It’s a choice not trying to prevent that all with your motto ‘let’s wait and see and hope Jeff Id is right’. Not my choice.
– “Nowhere near enough change to prevent the next ice age.”
It could well be that we humans are postponing the next ice age that probably would have come if humans never would have existed:
http://onlinelibrary.wiley.com/doi/10.1029/2004GC000891/abstract
August 23, 2015 at 23:53
Jos,
I’m tired of the conversation. Higher resolution climate models are inevitable, they will not help accuracy of feedback. You have to be a complete advocate not to recognize the dismal failures of climate models at this point. They need serious adjustment or the fake papers trying to correct the problem wouldn’t exist. This isn’t even something we can have an “opinion” on anymore. They are outside of a 20:1 certainty in trend and only a point measurement in the most biased of comparisons keeps them in the CI. Sorry if you can’t follow that, I’m not going to explain stats to you because I’m tired of the conversation.
The IPCC is NOT right about the problems because they have not successfully observed any as yet. Scientifically, that makes them wrong. Of course the ‘dangerous’ warming hasn’t happened either, so why should they observe any damages. Not that the inconvenient reality doesn’t prevent them from trying.
“– “See you let your views move into “solution land” as well.”
No, it’s just a logical conclusion from all the science (fig. 7 in the post) or even the calculations of Lewis: We need to reduce CO2 emissions. Not only to mitigate the warming to come but also to mitigate the unprecedented ocean acidification ”
Predictably, this has no foundation in science whatsoever. Immediate CO2 emission reduction is your own very political and very left-wing construct, a solution to a problem which doesn’t appear to exist. There are no damages from mild warming and some of us scientists think it will be highly beneficial. Either way, technology will provide the solutions with or without your heavy-handed economically destructive idealistic approach.
BTW, Ocean acidification is well below any of our ability to measure. Look closely and you will find out that the historic data is complete crap. You have no clue what you write, yet you are so certain. This data is the worst of the worst. Right there with tree rings. You probably believe in the hockey sticks too. That just means that you don’t really understand MV regression.
To finish, and I do hope we are finished, I don’t want to go with Jos’s economic suicide before we make our planet accidentally greener “solution” either. Not even a mildly smart choice.
Jos’s world: Let’s hurry up and do something certainly damaging to prevent the chance that we might be doing something damaging.
You need to open your mind sir. The do nothing — you claimed I propose is not accurate. I want to do everything but by free decisions of low regulation industry. It will work because technology will outstrip anything we can do otherwise. Your idea of limited economy, limited development, and limited freedom to prevent and imagined problem is small minded and incorrect.
Of course, you are obviously one of those who creates nothing and understands nothing of the economy.
August 24, 2015 at 01:29
@ Jeff Id
– “I’m tired of the conversation.”
That makes two of us. So this is my last reply.
– “..dismal failures of climate models..”
Again: no, see figures 2 and 3 and the explanation in the post.
– “..fake papers trying to correct the problem wouldn’t exist..”
Nonsense, you just don’t like the conclusions.
– “They are outside of a 20:1 certainty in trend…”
– “Sorry if you can’t follow that, I’m not going to explain stats..”
When forcings are lower than scenarios and when natural variation cools things after 2005 it would be very strange when the model trends did not overestimate the observations trend.
I’m not going to explain that to you anymore, because I’m also tired of this conversation.
– “The IPCC is NOT right about the problems because they have not successfully observed any as yet.”
It’s all about the future my friend.
– “Immediate CO2 emission reduction is your own very political and very left-wing construct, a solution to a problem which doesn’t appear to exist.”
You still don’t understand. I’m not left-wing, right-wing or whatever-wing. As I concluded earlier: your political/economic views seem to heavily influence your scientific ‘view’.
– “Ocean acidification is well below any of our ability to measure..”
– “You have no clue what you write..”
Your clearly are not a chemist, but I am one.
– “You probably believe in the hockey sticks too.”
I noticed that there are several other studies that showed exactly the same as Mann’s “hockey stick”. E.g. including the one (Ljunqvist) that Spencer showed in the US senate. There seems to be no study that contradicts Mann’s hockey stick:
– “You need to open your mind sir.”
– “..you are obviously one of those who creates nothing and understands nothing of the economy.”
I have the same opinion about your mind sir.
And yes, I’m not an economist or politically active. But I am interested in climate science and very able to draw logic conclusions from science. When I jump from a high building science tells me that I will hurt myself. When we burn fossil fuels science tells me the earth will warm and the carbonate ion concentration in the oceans will drop. Both things are happening now.
Dear Jeff Id,
You I and will never agree, so much is certain. I’m interested in the science and the future well-being of the human race and you are interested in economics. Good luck with it.
August 30, 2015 at 07:43
Could you please comment on this recent article by some norwegian statisticians: http://johnkdagsvik.altervista.org/wp-content/uploads/2015/07/TemperaturePaper.pdf – it hasn’t been published yet as far as I understand. But the authors are creating a lot of noise in norwegian media by claiming they are “censored” by the statistical authorities (ssb.no) here in Norway. They seem to think that their article represents something complete overlooked and new in the debate about global temperatures, and they maintain that the temperature trend for the last at least two thousand years is a random walk. I here copy the abstract: “Abstract:
This paper analyzes temperature data obtained from 96 world wide weather stations, as well as reconstruct-ed data from the last two millennia. Our model is derived from three invariance hypotheses. The first one is that the temperature process is stationary. The second one is that the distribution of the average tempera-ture over any specific time period does not depend on the length of the period apart from a scale transfor-mation. The third one is that the temperature process is Gaussian. These hypotheses imply that the temper-ature process is a so-called Fractional Gaussian noise process. This type of processes exhibits long range dependence. In order to test our hypotheses we have applied a graphical test based on the empirical char-acteristic function and a Chi-square test. The tests indicate that the most of the observed data are consistent with the Fractional Gaussian noise model as a representation of the temperature process. The tests also im-ply that the reconstructed data are consistent with Fractional Gaussian noise model.”
August 30, 2015 at 08:18
Karsten,
Stories along those lines keep popping up at random intervals (pun intended).
However, dismissing the warming of the past 150 years as merely a random walk quickly gets you in trouble with conservation of energy. The accumulated energy still has to come from somewhere, and wherever we look in the climate system observations show that it’s warming. So the warming doesn’t come from redistribution of energy it seems. Watch the blank stares and the refusal to answer if you were to ask them where the energy is coming from then.
I wrote about it in previous posts, e.g. https://ourchangingclimate.wordpress.com/2010/03/08/is-the-increase-in-global-average-temperature-just-a-random-walk/, https://ourchangingclimate.wordpress.com/2010/03/18/the-relevance-of-rooting-for-a-unit-root/, and a slightly sarcastic one https://ourchangingclimate.wordpress.com/2010/04/01/a-rooty-solution-to-my-weight-gain-problem/