Posts Tagged ‘Climate Science Survey’

New survey of climate scientists by Bray and von Storch confirms broad consensus on human causation

June 22, 2016

Bray and von Storch just published the results of their latest survey of climate scientists. It contains lots of interesting and very detailed information, though some questions are a little biased in my opinion. Still, they find a strong consensus on human causation of climate change: 87.4% of respondents are to some extent convinced that most of recent or near future climate change is, or will be, the result of anthropogenic causes (question v007). Responses were given on a scale from 1 (not at all) to 7 (very much). In line with Bray (2010) a response between 5 and 7 is considered agreement with anthropogenic causation. In their 2008 survey the level of agreement based on the same question was 83.5% and in 2013 it was 80.9%.

How convinced are you that most of recent or near future climate change is, or will be, the result of anthropogenic causes? (v007)
not at all   1     2     3     4     5     6     7   very much
Bray and von Storch 2015 - v007 how convinced are you that most of recent and future GW is or will be the result of anthropogenic activity

Question v013 asked a somewhat similar question as we did in our 2012 climate survey, namely the percentage of global warming that is attributable to human activities:

Since 1850, it is estimated that the world has warmed by 0.5 – 0.7 degrees C. Approximately what percent would you attribute to human causes? (v013)

1=0%   2=1-25%   3=25-50%   4=51-75%   5=76-100%
Bray and von Storch 2015 - v013 What percentage of global warming since 1850 do you attribute to human causes

84.2% of respondents picked one of the two answer options that correspond to the canonical “more than half” or “most” of global warming that according to the IPCC is human caused. However, the corresponding IPCC statement is with regards to warming since the 1950’s, about which there is a lot more confidence, whereas this question specifies the warming since 1850.

But wait a moment, hasn’t the earth warmed a lot more than 0.5-0.7 degrees C since 1850? Yes, it definitely has; we’ve recently breached the 1 degree mark relative to the 1850-1880 average, so the range given in their question is quite outdated. A defensible choice at the time of drafting the survey would have been to quote the latest IPCC number of 0.85 (0.65 to 1.06) degrees warming over the time period 1880-2012, even if current temperatures have gone up sharply since then.

HadCRUT4_Ref_1850_tm_1880

Global average surface temperature relative to the 1850-1880 mean. Last annual average shown is 2015; if the first few months of 2016 are a guide, the vertical scale might have to be adapted for 2016. Figure by Jos Hagelaars.

Moreover, the answer options for v013 do not cover the full range of possibilities. Natural factors could have caused warming or cooling. Imagine that natural factors would have caused a cooling of 0.1 degrees C since pre-industrial times (which is not at all implausible), then to achieve closure with the observed warming of 1.0 degrees, anthropogenic factors should have contributed 1.1 degrees, or 110% of the observed warming. We discussed this argument in detail in our ES&T paper emanating from the climate science survey we conducted in 2012.

I emailed Dennis Bray about these and other issues after having responded to their survey back in 2015. He defended their choice of lowballing the observed warming as being consistent with their previous surveys and not being much different from more recent, and also likely contested, estimates. Strangely, he disagreed with the possibility of a factor being responsible for more than 100% of the observed warming, even in the hypothetical example above.

Cook et al (myself included) recently wrote an article in which we reviewed the existing ‘consensus’ estimates. This latest Bray and von Storch survey finds a level consensus on attribution that is consistent with other studies, though towards the lower end of the range. From their description I don’t think there is a bias in their sample of scientists, though there is always the possibility of self-selection, where people might be more likely to respond to a survey if it originates from a source who they perceive to be credible. Repeatedly, surveys have found that the level of consensus goes up as you zoom in to a sample of scientists with more relevant expertise. The Bray and von Storch results, as are ours, are mostly representative of a broad group of climate related scientists.

A detail of particular interest to me is that the survey questions included the response option “no answer”. That explains the different sample size for different questions (“Number of obs”). It’s probably no coincidence that question v013 (asking for a specific range of percent contribution) has a smaller sample size (n=587), and by inference more “no answer” responses, than the other, but simpler, attribution question v007 (n=640). This is consistent with what we found in our 2012 climate science survey: fewer respondents picked a specific percentage range of attribution compared to providing a qualitative judgment thereof. Though admittedly “no answer” (in the Bray and von Storch survey) is less ambiguous in this context than “I don’t know”, “unknown” or “other” (in our survey).

Amidst the questions on science and society I perceived some questions to have an “anti-consensus” (v069) or “anti-alarmist” (v067) tone to it, but there were no questions asking for mirror image perceptions. Doomsday stories need to be investigated before they get out of hand (v067): of course. But no question was asked whether stories downplaying a scientifically established risk should be investigated. I would have likewise responded: of course. To his credit, Dennis Bray acknowledged in his email that this was an oversight on their part.

Richard Tol misrepresents consensus studies in order to falsely paint John Cook’s 97% as an outlier

September 24, 2015

John Cook warned me: if you attempt to quantify the level of scientific consensus on climate change, you will be fiercely criticized. Most of the counterarguments don’t stand up to scrutiny however. And so it happened.

The latest in this saga is a comment that Richard Tol submitted to ERL, as a response to John Cook’s study in which they found 97% agreement in the scientific literature that global warming is human caused. Tol tries to paint Cook’s 97% as an outlier, but in doing so misrepresents many other studies, including the survey that I undertook with colleagues in 2012. In his comment and his blogpost he shows the following graph:

Richard Tol misrepresenting existing consensus estimates

Richard Tol comes to very different conclusions regarding the level of scientific consensus than the authors of the respective articles themselves (Oreskes, 2004; Anderegg et al., 2010; Doran and Kendall Zimmerman, 2009; Stenhouse et al., 2013; Verheggen et al., 2014). On the one hand, he is using what he calls “complete sample” results, which in many cases are close to meaningless as an estimate of the actual level of agreement in the relevant scientific community (that counts most strongly for Oreskes and Anderegg et al). On the other hand he is using “subsample” results, which in some cases are even more meaningless (the most egregious example of which is the subsample of outspoken contrarians in Verheggen et al).

The type of reanalysis Tol has done, if applied to e.g. evolution, would look somewhat like this:

  • Of all evolutionary biology papers in the sample 75% explicitly or implicitly accept the consensus view on evolution. 25% did not take positon on whether evolution is accepted or not. None rejected evolution. Tol would conclude from this that the consensus on evolution is 75%. This number could easily be brought down to 0.5% if you sample all biology papers and count those that take an affirmative position in evolution as a fraction of the whole. This is analogous to how Tol misrepresented Oreskes (2004).
  • Let’s ask biologists what they think of evolution, but to get an idea of dissenting views let’s also ask some prominent creationists, e.g. from the Discovery Institute. Never mind that half of them aren’t actually biologists. Surprise, surprise, the level of agreement with evolution in this latter group is very low (the real surprise is that it’s not zero). Now let’s pretend that this is somehow representative of the scientific consensus on evolution, alongside subsamples of actual evolutionary biologists. That would be analogous to how Tol misrepresented the “unconvinced” subsample of Verheggen et al (2014).

Collin Maessen provide an detailed take-down of Richard Tol on his blog, quoting extensively from the scientists whose work was misrepresented by Tol (myself included). The only surveys which are not misrepresented are those by Bray and von Storch (2007; 2010). This is how I am quoted at Collin’s blog RealSkeptic:

Tol selectively quotes results from our survey. We provided results for different subsamples, based on different questions, and based on different types of calculating the level of agreement, in the Supporting Information with our article in ES&T. Because we cast a very wide net with our survey, we argued in our paper that subgroups based on a proxy for expertise (the number of climate related peer reviewed publications) provide the best estimate of the level of scientific consensus. Tol on the other hand presents all subsamples as representative of the scientific consensus, including those respondents who were tagged as “unconvinced”. This group consists to a large extent of signatories of public statements disapproving of mainstream climate science, many of whom are not publishing scientists. For example, some Heartland Institute staffers were also included. It is actually surprising that the level of consensus in this group is larger than 0%. To claim, as Richard Tol does, that the outcome for this subsample is somehow representative of the scientific consensus is entirely nonsensical.

Another issue is that Richard Tol bases the numbers he uses on just one of the two survey questions about the causes of recent climate change, i.e. a form of cherry picking. Moreover, we quantified the consensus as a fraction of those who actually answered the question by providing an estimate of the human greenhouse gas contribution. Tol on the other hand quantifies the consensus as a fraction of all those who were asked the question, including those who didn’t provide such an estimate. We provided a detailed argument for our interpretation in both the ES&T paper and in a recent blogpost.

Tol’s line of reasoning here is similar to his misrepresentation of Oreskes’ results, by taking the number of acceptance papers not just as a fraction of papers that take position, but rather as a fraction of all papers, including those that take no position on current anthropogenic climate change. Obviously, the latter should be excluded from the ratio, unless one is interested in producing an artificially low, but meaningless number.

Some quotes from the other scientists:

Oreskes:

Obviously he is taking the 75% number below and misusing it. The point, which the original article made clear, is that we found no scientific dissent in the published literature.

Anderegg:

This is by no means a correct or valid interpretation of our results.

Neil Stenhouse:

Tol’s description omits information in a way that seems designed to suggest—inaccurately—that the consensus among relevant experts is low.

Doran:

To pull out a few of the less expert groups and give them the same weight as our most expert group is a completely irresponsible use of our data.

You can read their complete quotes at RealSkeptic.

See also this storify of my twitter discussion with Richard Tol.

Rick Santorum misrepresents our climate survey results on Bill Maher show

September 2, 2015

In our survey of more than 1800 scientists we found that the large majority agree that recent climate change is predominantly human induced. The article where we discuss our results is publicly available and a brief rundown of the main conclusions is provided in this blogpost.

We were quite surprised to hear a US Presidential candidate, Rick Santorum, make the opposite claim based on our survey. On the Bill Maher show he said:

The most recent survey of climate scientists said about 57 percent don’t agree with the idea that 95 percent of the change in the climate is caused by CO2. (…) There was a survey done of 1,800 scientists, and 57 percent said they don’t buy off on the idea that CO2 is the knob that’s turning the climate. There’s hundreds of reasons the climate’s changed.

What did we actually find in our survey?

In our survey of 1868 scientists studying various aspects of climate change, we asked two questions about the causes of recent global warming. Of all scientists who provided an estimate ~85% think that the influence of human greenhouse gases is dominant, i.e. responsible for more than half of the observed warming. ~15% think greenhouse gases are responsible for less than half of the observed warming. If you zoom in to those respondents with arguably more expertise, the percentage agreeing with human dominated warming becomes 90% or larger.

The existence of a strong scientific consensus about climate change is also clear from previous surveys of scientists and of the scientific literature and from statements of scientific societies. A scientific consensus is a logical consequence of the evidence for a certain position becoming stronger over time.

Rick Santorum’s claim is misleading and wrong because:

1) it is based on a wrong interpretation of just one of the two survey questions about the causes of recent climate change.

2) it is based on the argument that respondents who didn’t provide a specific estimate for the contribution of greenhouse gases (22% of the total number) think that this contribution is small. That is a wrong inference.

3) it is based on the argument that respondents who think it is “very likely” or “likely” or “more likely than not” that greenhouse gases are the dominant cause of recent warming disagree with this dominant influence. That is a wrong inference.

Politifact also did a fact-check of Santorum’s claim and found it to be false. It gives a very good overview of what’s wrong with Santorum’s claim. Several people are quoted in their article, myself included as well as the blogger Fabius Maximus who came up with the 43% consensus figure used by Santorum to claim a 57% dissensus:

(more…)

PBL survey shows strong scientific consensus that global warming is largely driven by greenhouse gases

August 4, 2015

Updates:

(5 Sep 2015): US Presidential candidate Rick Santorum used an erroneous interpretation of our survey results on the Bill Maher show. My  detailed response to Santorum’s claim is in a newer blogpost. Politifact and Factcheck also chimed in and found Santorum’s claims to be false. The blogpost below goes into detail about how different interpretations could lead to different conclusions and how some interpretations are better supported than others.

As Michael Tobis rightly points out, the level of scientific consensus that you find “depends crucially on who you include as a scientist, what question you are asking, and how you go about asking it”. And on how you interpret the data. We argued that our survey results show a strong scientific consensus that global warming is predominantly caused by anthropogenic greenhouse gases. Others beg to differ. Recent differences of opinion are rooted in different interpretations of the data. Our interpretation is based on how we went about asking certain questions and what the responses indicate.

To quantify the level of agreement with a certain position, it makes most sense to look at the number of people as a fraction of those who answered the question. We asked respondents two questions about attribution of global warming (Q1 asking for a quantitative estimate and Q3 asking for a qualitative estimate; the complete set of survey questions is available here). However, as we wrote in the ES&T paper:

Undetermined responses (unknown, I do not know, other) were much more prevalent for Q1 (22%) than for Q3 (4%); presumably because the quantitative question (Q1) was considered more difficult to answer. This explanation was confirmed by the open comments under Q1 given by those with an undetermined answer: 100 out of 129 comments (78%) mentioned that this was a difficult question.

There are two ways of expressing the level of consensus, based on these data: as a fraction of the total number of respondents (including undetermined responses), or as a fraction of the number of respondents who gave a quantitative or qualitative judgment (excluding undetermined answers). The former estimate cannot exceed 78% based on Q1, since 22% of respondents gave an undetermined answer. A ratio expressed this way gives the appearance of a lower level of agreement. However, this is a consequence of the question being difficult to answer, due to the level of precision in the answer options, rather than it being a sign of less agreement.

Moreover, the results in terms of level of agreement based on Q1 and Q3 are mutually consistent with each other if the undetermined responses are omitted in calculating the ratio; they differ markedly when undetermined responses are included. In the supporting information we provided a table (reproduced below) with results for the level of agreement calculated either as a fraction of the total (i.e., including the undetermined answers) or as a fraction of those who expressed an opinion (i.e., excluding the undetermined answers), specified for different subgroups.

Verheggen et al - EST 2014 - Table S3

For the reasons outlined above we consider the results excluding the undetermined responses the most meaningful estimate of the actual level of agreement among our respondents. Indeed, in our abstract we wrote:

90% of respondents with more than 10 climate-related peer-reviewed publications (about half of all respondents), explicitly agreed with anthropogenic greenhouse gases (GHGs) being the dominant driver of recent global warming.

This is the average of the two subgroups with the highest number of self-reported publications for both Q1 and Q3. In our paper we discussed both ways of quantifying the level of consensus, including the 66% number as advocated by Tom Fuller (despite his claims that we didn’t).

Fabius Maximus goes further down still, claiming that the level of agreement with IPCC AR5 based on our survey results is only 43-47%. This result is based on the number of respondents who answered Q1b, asking for the confidence level associated with warming being predominantly greenhouse gas-driven, as a fraction of the total number of respondents who filled out Q1a (whether with a quantitative or an undetermined answer). As Tom Curtis notes, Fab Max erroneously compared our statement to the “extremely likely” statement in AR5, whereas in terms of greenhouse gases AR5 in Chapter 10 considered it “very likely” that they are responsible for more than half the warming. Moreover, our survey was undertaken in 2012, long before AR5 was available, so if respondents had IPCC in mind as a reference, it would have been AR4. If anything, the survey respondents were by and large more confident than IPCC that warming had been predominantly greenhouse gas driven, with over half assigning a higher likelihood than IPCC did in both AR4 and AR5.

PBL background report - Q1b

Let me expand on the point of including or excluding the undetermined answers with a thought experiment. Imagine that we had asked whether respondents agreed with the AR4 statement on attribution, yes or no. I am confident that the resulting fraction of yes-responses would (far) exceed 66%. We chose instead to ask a more detailed question, and add other answer options for those who felt unwilling or unable to provide a quantitative answer. On the other hand, imagine if we had respondents choose whether the greenhouse gas contribution was -200, -199, …-2, -1, 0, 1, 2, … 99, 100, 101, …200% of the observed warming. The question would have been very difficult to answer to that level of precision. Perhaps only a handful would have ventured a guess and the vast majority would have picked one of the undetermined answer options (“I don’t know”, “unknown”, “other”). Should we in that case have concluded that the level of consensus is only a meagre few percentage points? I think not, since the result would be a direct consequence of the answer options being perceived as too difficult to meaningfully choose from.

Calculating the level of agreement in the way we suggest, i.e. excluding undetermined responses, provides a more robust measure as it’s relatively independent of the perceived difficulty of having to choose between specific answer options. And, as is omitted by the various critics, it is consistent with the responses to the qualitative attribution question, which also provides a clear indication of a strong consensus. If you were to insist on including undetermined responses in calculating the level of agreement, then it’s best to only use results from Q3. Tom Fuller’s 66% becomes 83% in that case (the level of consensus for all respondents), showing the lack of robustness in this approach when applied to Q1.

Verheggen et al - Figure 1 - GHG contribution to global warming

Some other issues that came up in recent discussions:

See also the basic summary of our survey findings and the accompanying FAQ.


Responses to the Climate Science Survey

April 12, 2015

Appeared in similar form on the PBL website

In the Spring of 2012, the Netherlands Environmental Assessment Agency PBL held a survey among 1868 scientists studying various aspects of climate change, including physical climate, climate impacts, and mitigation. The main results of the survey were published in an article in Environmental Science and Technology (ES&T) in August 2014: “Scientists’ views about attribution of global warming”. It showed that there is widespread agreement regarding a dominant influence of anthropogenic greenhouse gases on recent global warming. This agreement is stronger among respondents with more peer-reviewed publications.

A background report with the results for all 31 questions has now been made available. The total number of responses for each answer option is provided and a subdivision into seven groups for five questions. The background report contains previously unpublished data. Some highlights are provided below.

Climate sensitivity

Respondents were asked for their opinion regarding the best estimate and likely range for equilibrium climate sensitivity (ECS). This is an important quantity for projections of global warming, as it gives the expected warming that would follow from a doubling in atmospheric CO2 concentration after the climate system has equilibrated to the new conditions. Thus, expected warming in the future depends on the combination of total emissions and climate sensitivity.

The figure below gives the average estimates of ECS from 7 groups of respondents, including authors of the Working Group I report of the fourth IPCC Assesment Report (AR4), respondents who signed public declarations critical of mainstream climate science as embodied by IPCC (‘unconvinced’), and four different subgroups distinguished according to their self-declared number of climate related peer-reviewed publications (0–3; 4–10; 11–30; more than 30). Results from most groups were very close to the IPCC range (1.5-4.5 °C) mentioned in the fifth assessment report (AR5) – except those tagged as ‘unconvinced’ which strongly deviated from the other groups, and to a lesser extent the group of respondents with three or less publications. For all subgroups the ‘best estimate’ was slightly lower than the ‘best estimate’ reported in AR4 (i.e. 3 °C). AR5 provided no best estimate.

Scientists views on climate sensitivity - PBL

Role of climate science in society

Respondents were also asked their opinion about seven statements regarding the role of climate science in society and how the science should be communicated. There was a strong consensus that scientists themselves should communicate with both policymakers and the general public about climate change and that communication with the general public should focus on solid knowledge. To a lesser extent there was agreement that risks and uncertainties should be emphasised during such communication. Responses varied more strongly about whether or not existing uncertainties in climate science strengthen the case for mitigation (i.e. to avoid potential low probability, high impact events). There was (strong) disagreement with the statement that climate science would be too uncertain to be useful for policymaking on climate change.

Scientists views on role of science in society - PBL

The role of the sun in global warming

In the public debate about climate change the role of the sun is often put forward as an alternative explanation for global warming. Question 17 asked what fraction of recent global warming could be attributed to the sun. Those tagged as ‘unconvinced’ had the lowest fraction of respondents that indicated that they don’t know (together with AR4 authors) and the highest fraction that said that the role of the sun is unknown. As expected they also had by far the highest fraction (27%) that believed that the sun caused more than half of recent global warming.

As with the attribution questions (see the ES&T article), there appears to be a trend in responses going from the group with fewest publications to those with most. The more publications about climate change respondents report to have written, the larger fraction of them agree with the IPCC position that the sun hardly played a role in recent global warming, since the solar output decreased slightly over that period.

Scientists views on the role of the sun in global warming - PBL

More information:

PS: I’ll have a poster presentation about the survey at the EGU conference this week, in session EOS6 “Communication and Education in Geoscience” on Thursday evening.

Video-interview about climate science survey paper

September 26, 2014

Fellow Dutchman Collin Maessen interviewed me via skype about our recent paper “Scientists’ views about attribution of global warming“:

Collin wrote a blogpost about it as well which is well worth a read, giving a bit of context from other opinion and literature surveys.

The interview starts off with the general findings regarding the level of consensus, then focusing on how this compares with previous studies, how the media coverage is slanted towards contrarian views, and he gives me a chance to talk about my favorite part, how aerosol cooling masks the greenhouse warming and how this makes the phrasing of the IPCC AR4 attribution statement, by focusing only on the greenhouse warming part, prone to being misinterpreted. These aspects were also discussed in my blogpost from last month.

FAQ for the article “Scientists’ Views about Attribution of Global Warming”

August 11, 2014

published in Environmental Science and Technology (open access), DOI: 10.1021/es501998e, Supporting Information here.

A formal version of the FAQ is also available at the website of the PBL Netherlands Environmental Assessment Agency. A blog post with a brief description of the main conclusions is here.


General

1. What are the objectives of this survey?

The PBL aimed to characterize the spectrum of scientific opinion about physical climate science issues. The research was focused on issues that are a frequent topic of public debate, and explored questions such as:

  • On which issues is there widespread agreement amongst scientists?
  • On which issues do scientists hold varied opinions?
  • How does the spectrum of scientific opinion compare to IPCC assessments?
  • How do scientists view skeptical arguments and viewpoints?

2. What is the relevance of an opinion survey or of measurement of consensus in trying to assess the science?

Science is based on the critical evaluation of available evidence in the context of existing knowledge. It is not “just an opinion.” With this survey, we tried to identify how scientists assess the different viewpoints that exist in public discussions of climate science. If the evidence for a certain viewpoint has become sufficiently strong and stable over time, the scientists’ aggregated opinion could be expected to reflect that.

3. Are the survey results publicly available?

The full survey results are not publicly available, because the PBL intends to use the data for further analyses.
Update:
Graphs with the ‘straight counts’ for every question (i.e. the number of responses for each answer option) are available in a background report. These results are not segregated in different sub-groups.


Conclusions

4. How does this study compare to the often-quoted 97% consensus?

Our results are consistent with similar studies, which all find high levels of consensus among scientists, especially among scientists who publish more often in the peer-reviewed climate literature.

Cook et al. (2013) found that 97% of papers that characterized the cause of recent warming indicated that it is due to human activities. (John Cook, the lead author of that analysis, is co-author on this current article.) Similarly, a randomized literature review found zero papers that called human-induced climate change into question (Oreskes, 2004).

Other studies surveyed scientists themselves. For instance, Doran and Kendall-Zimmermann (2009) found lower levels of consensus for a wider group of earth scientists (82% consensus) as compared to actively publishing climatologists (97% consensus) on the question of whether or not human activity is a “significant contributor” to climate change. Our results are also in line with those of e.g. Bray and von Storch (2008) and Lichter (2007).

In our study, among respondents with more than 10 peer-reviewed publications (half of total respondents), 90% agree that greenhouse gases are the largest – or tied for largest – contributor to recent warming. The level of agreement is ~85% for all respondents.

While these findings are consistent with other surveys, several factors could explain the slight differences we found:

  • Surveys like ours focus on opinions of individual scientists, whereas in a literature analyses the statements in individual abstracts are tallied. Literature analyses have generally found higher levels of consensus than opinion surveys, since the consensus is stronger amongst more heavily published scientists.
  • This study sets a more specific and arguably higher standard for what constitutes the consensus position than other studies. For instance, Doran and Kendall-Zimmermann (2009) asked about human activity being a “significant contributor” to global warming, and Anderegg et al. (2010) investigated signatories of public statements, while we asked specifically about the degree to which greenhouse gases are contributing to climate change in comparison with other potential factors.
  • Contrarian viewpoints are somewhat overrepresented in our survey and they may have overestimated their self-declared level of expertise (see question 9).

5. How is the consensus or agreement position defined?

The consensus position was defined in two ways:

  • Greenhouse gases contributed more than 50% to global warming since the mid-20th (Question 1). This is analogous to what was written in IPCC AR4.
  • Greenhouse gases have caused strong or moderate warming since pre-industrial times (Question 3). “Moderate” warming was only interpreted as the consensus position if no other factor was deemed to have caused “strong” warming. This response means that greenhouse gases were considered the strongest –or tied for strongest- contributor to global warming.

The former definition exactly mirrors the main attribution statement in IPCC AR4 and served as a ‘calibration’ for the latter.

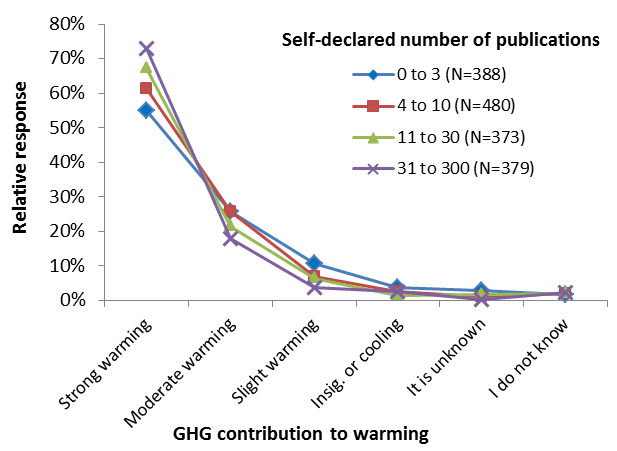
6. What does “relative response” mean on the y-axis of many Figures?

This gives the percentage of the respondents (often within a certain sub-group) for the specific answer option. We opted to show the relative response rather than the absolute response to enable comparing the responses of different sub-groups (with differing group sizes as denoted by N=…) within one graph.

7. What are “undetermined” answers?

Those are the sum of responses “I don’t know”, “unknown” and “other”.

8. Why do IPCC AR4 authors show a higher consensus than the other respondents?

AR4 authors are generally domain experts, whereas the survey respondents at large comprise a very broad group of scholars, including for example scientists studying climate impacts or mitigation. Hence we consider this to be an extension of the observation -in this study and in e.g. Anderegg et al. (2010) and Doran and Kendall-Zimmermann (2009) – that the more expert scientists report stronger agreement with the IPCC position. Moreover, on the question of how likely the greenhouse contribution exceeded 50%, many respondents provided a stronger statement than was made in AR4. Using a smaller sample of scientists, Bray (2010) found no difference in level of consensus between IPCC authors and non-authors.

9. How reliable are the responses regarding the respondent’s area of expertise and number of peer-reviewed publications?

Respondents were tagged with expertise fields, though these were in many cases limited and not meant to be exhaustive. These tags were mainly used to ensure that the group of respondents was representative of the group that the survey was sent to. A subset of respondents was also tagged with a Google Scholar metric. Those who were tagged as “unconvinced” reported more expertise fields than the total group of respondents and also a higher number of publications compared to their Google Scholar metrics, if available (see Supplemental Information).

10. Since most scientists agree with the mainstream and therefore most media coverage is mainstream, what is the problem with “false balance”?

Scientists with dissenting opinions report receiving more media attention than those with mainstream opinions. This results in a skewed picture of the spectrum of scientific opinion. Whether that is problematic is in the eye of the beholder, but it may partly explain why public understanding lags behind scientific discourse (e.g. the “consensus gap”).


Survey Respondents

11. How many responses did you get to the survey?

Out of 6550 people contacted, 1868 filled out the survey (either in part or in full).

12. How did you compile the list of people to be surveyed?

Respondents were selected based on

  • keyword search in peer-reviewed publications (“global climate change” and “global warming”)
  • recent climate literature (various sources)
  • highly cited climate scientists (as listed by Jim Prall)
  • public criticisms of mainstream climate science (as listed by Jim Prall)

13. Are all of the survey invitees climate scientists?

The vast majority of invitees are scientists who published peer-reviewed articles about some aspect of climate change (this could be climate science, climate impacts, mitigation, etc.). Not all of them necessarily see themselves as climate scientists.

14. Why did you invite non-scientist skeptics to take part in the survey?

They were included in the survey to ensure that the main criticisms of climate science would be included. They constitute less then 5% of the survey respondents. Viewpoints that run counter to the prevailing consensus are therefore somewhat magnified in our results.

15. How representative are the survey responses of the “scientific opinion”?

It’s difficult to ascertain the extent to which our sample is representative, especially because the target group is heterogeneous and hard to define. We have chosen to survey the wider scientific field that works on climate change issues. Due to the criteria we used and the number of people invited we are confident that our results are indeed representative of this wider scientific field studying various aspects of global warming. We checked that those who responded to the survey were representative of the larger group of invitees by using various pieces of meta-information.

16. Did you take into account varying levels of expertise of respondents?

Respondent were asked to list their area(s) of expertise and their number of peer-reviewed publications. These and other attributes were used to interpret differences in responses.

17. How did you prevent respondents from manipulating the survey results, e.g. by answering multiple times?

An automatically generated, user specific token ensured that respondents could only respond once.

18. How did you ensure respondent anonymity?

Survey responses were analyzed by reference to a random identification number.


Survey Questions

19. Are the survey questions public?

Yes, survey questions and answer options are available on the PBL website and as Supporting Information (part 2) to the article.

20. How did you decide on the questions to ask?

The survey questions are related to physical science issues which are a frequent topic of public debate about climate change.

21. Was the survey reviewed before it was sent to respondents?

Yes, before executing the survey it has been extensively tested and commented on by various climate scientists, social scientists and science communicators with varying opinions, to ensure that questions were both clear and unbiased. Respondents were not steered to certain answers.

——-

Reference: Bart Verheggen, Bart Strengers, John Cook, Rob van Dorland, Kees Vringer, Jeroen Peters, Hans Visser, and Leo Meyer, Scientists’ Views about Attribution of Global Warming, Environmental Science and Technology, 2014. DOI: 10.1021/es501998e. Supporting Information available here.

Please keep discussions on this thread limited to what is mentioned in this FAQ and to other questions you may have about the survey or the article. Discussion of the survey results should be directed at the more generic blog post.

Survey confirms scientific consensus on human-caused global warming

August 11, 2014
  • A survey among more than 1800 climate scientists confirms that there is widespread agreement that global warming is predominantly caused by human greenhouse gases.
  • This consensus strengthens with increased expertise, as defined by the number of self-reported articles in the peer-reviewed literature.
  • The main attribution statement in IPCC AR4 may lead to an underestimate of the greenhouse gas contribution to warming, because it implicitly includes the lesser known masking effect of cooling aerosols.
  • Self-reported media exposure is higher for those who are skeptical of a significant human influence on climate.

In 2012, while temporarily based at the Netherlands Environmental Assessment Agency (PBL), my colleagues and I conducted a detailed survey about climate science. More than 1800 international scientists studying various aspects of climate change, including e.g. climate physics, climate impacts and mitigation, responded to the questionnaire. The main results of the survey have now been published in Environmental Science and Technology (doi: 10.1021/es501998e).

Level of consensus regarding attribution

The answers to the survey showed a wide variety of opinions, but it was clear that a large majority of climate scientists agree that anthropogenic greenhouse gases are the dominant cause of global warming. Consistent with other research, we found that the consensus is strongest for scientists with more relevant expertise and for scientists with more peer-reviewed publications. 90% of respondents with more than 10 climate-related peer-reviewed publications (about half of all respondents), agreed that anthropogenic greenhouse gases (GHG) are the dominant driver of recent global warming. This is based on two different questions, of which one was phrased in similar terms as the quintessential attribution statement in IPCC AR4 (stating that more than half of the observed warming since the 1950s is very likely caused by GHG).

Verheggen et al - Figure 1 - GHG contribution to global warming


Figure 1. The more publications the respondents report to have written, the more important they consider the contribution of greenhouse gases to global warming. Responses are shown as a percentage of the number of respondents (N) in each subgroup, segregated according to self-reported number of peer-reviewed publications.

Literature analyses (e.g. Cook et al., 2013; Oreskes et al., 2004) generally find a stronger consensus than opinion surveys such as ours. This is related to the stronger consensus among highly published – and arguably the most expert – climate scientists. The strength of literature surveys lies in the fact that they sample the prime locus of scientific evidence and thus they provide the most direct measure of the consilience of evidence. On the other hand, opinion surveys such as ours can achieve much more specificity about what exactly is agreed upon and where the disagreement lies. As such, these two methods for quantifying scientific consensus are complementary. Our questions possibly set a higher bar for what’s considered the consensus position than some other studies. Furthermore, contrarian viewpoints were likely overrepresented in our study compared with others.

No matter how you slice it, scientists overwhelmingly agree that recent global warming is to a great extent human caused.

(more…)

Climate Science Survey – the questions

October 8, 2012

In the spring of 2012, a large scale climate science survey was held amongst 6500 scientists studying various aspects of global warming. The survey was spearheaded by the Netherlands Environmental Assessment Agency (PBL), where I was responsible for the execution and analysis during the first half of 2012.

The objective of this study is to gain insight into how climate scientists perceive the public debate on the physical scientific aspects of climate change. More info about the survey was posted on the PBL website at the time, which has recently been updated to include a link to the survey questionnaire. Please note that the survey is no longer active.

Some confusion has arisen over the status of this survey. I responded at WUWT in an attempt to clarify:

We undertook a survey in March/April of this year (which, as Hans Labohm mentioned in a comment on WUWT, had been previewed by a variety of people with different viewpoints). Some respondents, e.g. Timothy Ball, asked to see the questions again. After internal consultation, we decided to publish the survey questions on the institute’s website, so that they are viewable to all. We contacted the survey respondents to inform them of the questions being available to view. I informed Dr Ball of this as well, to follow-up on my earlier email to him.

Our email to all respondents, informing them of the fact that the survey questions are available on the web, was apparently misunderstood to mean that we were again soliciting responses to a survey; this is however not the case. Roger Pielke Sr had already put a notice about the survey on his blog, which he has since updated after an email clarifying that this is an inactive survey, to which he had previously responded.

Below we (Bart Verheggen and Bart Strengers) reply to some of the more substantive questions regarding the survey questions raised on WUWT. However, we will not discuss results or the survey sample at this point in time. We will do so when our manuscript has been accepted.

(more…)