AUC student blog: 1.5 to stay alive

April 29, 2022 by

For the past few years I’ve assigned students to write a blog post as part of the theme course “Energy, Climate and Sustainability” at Amsterdam University College (AUC). Check out the blog at auclimate.wordpress.com/.

The blogposts cover a wide range of topics, from the environmental impacts of tourism in Thailand, to biomimicry, to eco-housing, to absurdism. And this engaging blogpost on the 1.5 degree target, written by Leo:

You have likely heard of the 1.5°C limit for global warming. Perhaps you are even familiar with the saying: “1.5 to stay alive.” But do you know where this saying came from or why such a seemingly small and arbitrary number was chosen to be our goal not to surpass? And what happens if we do surpass 1.5°C of warming? And how likely is that to happen? In order to answer these questions, one must examine a combination of scientific studies, data sets, public policy agreements, and historical happenings. This blogpost will do just that. The story of the introduction of the 1.5°C limit is a tale of triumph for the underdogs, while the story of what will happen if we don’t limit warming to 1.5°C (and we probably won’t) fits more into the apocalyptic genre.

Read on here.

Misinformation in Planet of the Humans

April 30, 2020 by

Jeff Gibbs’ new documentary, Planet of the Humans, is raising a lot of hackles. Strangely enough, the documentary appeals to pseudo-skeptics as well as anti-capitalists and neo-Malthusians, but of course for very different reasons.

Pseudo-skeptics love the film’s indictment of renewable energy and the environmental movement, especially since a left-wing icon like Michael Moore is associated with the film as its executive producer.

Some fervent environmentalists, on the other hand, applaud the film’s underlying message – that overpopulation and capitalism are the source of all evil – and apparently turn a blind eye to the many falsehoods it contains.

Because the documentary is full of it. To give an example: they claim that it takes more energy to produce solar panels than they produce during their lifetime. That’s not true. The energy payback time is a few years. Many of the clips and numbers mentioned (such as the efficiency of solar panels) are already 10 years old.  And contrary to what is argued in the film, electric vehicles emit less CO2 than their gasoline counterparts, even if the electricity is derived from the grid. The unsubstantiated attacks on renewable energy probably originate at least in part from Ozzie Zehner, author of the book “Green Illusions” and producer of the documentary, in which he features as an expert while spouting untruths.

The film also takes aim at some high profile environmentalists, such as Bill McKibben of 350.org. McKibben responds here to the allegations made against him.

Despite all the misinformation, is there also something positive to say about the documentary? Valid points are certainly being raised, but they are barely elaborated on and any nuance or context is sorely lacking. Yes, using wood pellets as an energy source in power stations can be legitimately criticized, but no, that does not mean that all biomass energy is ‘bad’ by definition. Contrary to what is insinuated in the film, many environmental organizations are in fact extremely critical – and sometimes downright dismissive – of biomass as an energy source. The sustainability of biomass critically depends on how and where it is produced.

The documentary doesn’t seem to be primarily concerned with mitigating climate change; it’s chiefly an indictment of the capitalist system and its reliance on economic growth. There is certainly a good discussion to be had about this, but unfortunately this film doesn’t contribute to such, due to the many inaccuracies and the lack of any depth and nuance.

******

To see this in context, the Kaya identity is a useful tool:

In the Kaya identity, the CO2 emissions (left hand side) are decomposed into various factors, namely (in order of appearance on the right hand side) the number of people; economic productivity per capita; energy intensity of the economy; CO2-intensity of energy. This is essentially a specific form of the I=PAT equation: Impact = Population × Affluence × Technology.

In order to bring CO2 emissions to zero, we will have to use CO2-free energy and use it more efficiently. That is what we aim to achieve with the energy transition. Population growth and economic growth can only be controlled to a very limited extent, aside from the question of its desirability.

The effect of economic welfare and population can be clearly seen in the world map below, where the size of each country is scaled according to their CO2 emissions. It is clear that the richer countries emit many times more CO2 than the poorer countries. The difference is in some cases more than a factor 100. Population growth is highest in poor countries, where the per capita emissions are only a fraction of those in the rich part of the world. Pointing to population growth as the most important factor behind the climate crisis, as argued in the film, is therefore very cynical.

Yes, there are good reasons to question over-consumption, but no, limiting economic growth is not going to keep warming below one and a half degrees. I don’t think poor countries will be enamoured by rich white men from the West (“Stupid White Men” by Michael Moore is on my bookshelf) denying them of their economic development. After all, how else do the filmmakers envisage that CO2 emissions will be brought down?

Low-CO2 energy sources are indispensable to achieve that goal, no matter how you slice it. The pros and cons of different energy sources certainly need to be discussed. But as with the discussion about climate science: please leave out demonstrable untruths. Misinformation, as this film provides in truckloads, does not contribute to the discussion. To the contrary.

Zie de Nederlandse versie op ons klimaatverandering blog.

Other sources:

Planet of the humans: A reheated mess of lazy, old myths

Michael Moore produced a film about climate change that’s a gift to Big Oil

Moore’s Boorish Planet of The Humans: An Annotated Collection

Climate change as a matter of risk management requires different choices in communication

June 11, 2018 by

Rowan Sutton just published a very short article (an “idea”) in ESDD entitled “a simple proposal to improve the contribution of IPCC WG1 to the assessment and communication of climate change risks”. From a risk management point of view a focus solely on the most likely outcome is not recommended, especially when the impacts increase sharply towards one end of the scale.

Sutton:

A common measure of risk is likelihood x impact (Fig 1). It is standard practice in risk assessment to highlight both the most likely impacts and low likelihood high impact scenarios. Such scenarios merit specific attention because the associated costs can be extremely high, so decision makers need to know about them. It follows that WGI has a responsibility to assess and communicate explicitly the scientific evidence concerning potential high impact scenarios, even when the likelihood of occurrence is assessed to be small. In past reports the assessment of key parameters by WG1 has focussed overwhelmingly on likely ranges only. When information has been provided about the tails of distributions only likelihoods have been communicated using terms – following the IPCC’s uncertainty guidance (Mastrandrea et al, 2010) – such as “very unlikely” or “extremely unlikely”: a clear steer that policy makers should largely ignore such possibilities. But this is wrong. Policy makers care about risk not likelihood alone. The IPCC’s uncertainty guidance ignores impact and is symmetric with respect to high or low impact scenarios; this is inappropriate for the communication of risk (Fig 1).

Figure 1: A schematic representation of how climate change risk depends on equilibrium climate sensitivity (ECS).

Some will argue that the WGII report is needed to provide information on impacts. For detailed information this is certainly the case, but the general shape of the damage function for a large basket of impacts (Fig 1) is insensitive to such details, and is all that is needed to justify WGI providing a much more thorough assessment of relevant scenarios. Other critics will suggest that for WGI to identify high impact scenarios explicitly would constitute scaremongering; this concern is no doubt one reason why previous WGI reports have focused so much on the likely range. But it is misguided. Policy makers need to know about high impact scenarios and WGI has a responsibility to contribute its considerable expertise to making the appropriate assessments.

A very similar point has been made by Kerry Emanuel in his post “Tail risk vs Alarmism” on CCNF:

In assessing the event risk component of climate change, we have, I would argue, a strong professional obligation to estimate and portray the entire probability distribution to the best of our ability. This means talking not just about the most probable middle of the distribution, but also the lower probability high-end risk tail, because the outcome function is very high there.

(…)

But there are strong cultural biases running against any discussion of this kind of tail risk, at least in the realm of climate science. The legitimate fear that the public will interpret any discussion whatsoever of tail risk as a deliberate attempt to scare people into action, or to achieve some other ulterior or nefarious goal, is enough to make almost all scientists shy away from any talk of tail risk and stick to the safe high ground of the middle of the probability distribution. The accusation of “alarmism” is quite effective in making scientists skittish in conveying tail risk, and talking about the tail of the distribution is a sure recipe to be so labelled.

Hans Custers schreef een kort Nederlandstalig blog over Sutton’s artikel.

Wait a Second…. You’re Telling Me That Global WARMING May Be Making our Winters COLDER? Please Explain.

March 27, 2018 by

One of my students, Judith, wrote a blogpost on the Warm Arctic –Cold Continent hypothesis:
“Due to the fact that the Arctic is warming much faster compared to anywhere else on earth, the latitudinal temperature gradient is decreasing. This causes the jet stream to meander, weakening the vortex, moving cold air south and warm air north.”

There will be a new blogpost written by a student of Amsterdam University College (AUC) almost every weekday until 26 April on a topic related to climate change, energy, and sustainability. Check out the blog at https://auclimate.wordpress.com/

Energy, Climate & Sustainability

Introduction

While I have been educated in English for most of my life, and even my iPhone settings are completely in English, I have always preferred reading the news in Dutch. As I was scrolling through NU.nl on a particularly cold Saturday morning, an interesting article named “Freezing cold in March: ‘we can expect these kind of periods more often’” (roughly translated), caught my attention. While the article does state that the future winters will know more (cold) extremes due to the melting of the Arctic, it lacked an explanation of why/how this occurs. Out of curiosity I continued to further investigate the topic with one question in mind, is our cold bitter winter season in the Netherlands ultimately caused by global warming?

Initially I hoped some other Dutch media source had shown an interest in the cold weekend as well. Unfortunately, only RTL news had published a…

View original post 1,432 more words

How blogs convey and distort scientific information about polar bears and Arctic sea ice

December 22, 2017 by

Our article on sea ice and polar bears proved to be a hot-button issue in the blogosphere. This was not entirely unexpected, of course. What is striking though, is that amidst all the criticism nobody has challenged our core finding: blogs on which man-made climate change and its impacts are downplayed are far removed from the scientific literature, at least regarding the topic of shrinking Arctic sea ice and the resulting future threat to polar bears.

Even more so, alternative figures that have been prepared by some critics basically underscore this same message (see examples below). That’s not so strange of course, since the signal is so clear: there is hardly any overlap between contrarian blogs and the scientific literature on this topic. Take a look at the pie-charts below for the three statements on sea ice and those on polar bears, for the two different groups of blogs (termed denier and science-based blogs, respectively), and the peer-reviewed scientific articles that investigate both polar bears and Arctic sea ice. This is basically an extension of figure 1 in the paper, in which only the two blog categories were shown. Most scientific articles as well as science-based blogs assess Arctic sea ice extent to be shrinking and polar bears to be threatened as a result, and most denier blogs take a contrary view on both sea ice and polar bears. They are poles apart.

You may argue that it was overkill to use an elaborate statistical analysis such as PCA on this dataset. It was used mainly to visualize our results in one figure. All the criticism on the PCA and the details of how data were analyzed misses the forest for the trees: there is a clear distinction between blogs, where the group that accepts AGW appears to base their claims on peer-reviewed science, and the group that doesn’t accept AGW does not. The latter group appear to base their claims to a large extent on blogs written by one particular biologist, Susan Crockford, whose views run counter to the relevant ecological literature.

Our paper is first and foremost a characterization of the blogosphere, and how it compares to the scientific literature. We restricted our literature search to scientific articles that investigate both polar bears and sea ice, and that shed light on polar bear ecology and how it may or may not depend on the presence of sea ice. An article such as “Evolutionary roots of iodine and thyroid hormones in cell signaling” does not fit that bill, to name just one example of Crockford’s scientific articles that has been pointed out as evidence of her having published on polar bear ecology. She has not.

Even though it is not the main scope of our paper, we described the scientific context of polar bear ecology and explained how and why polar bears depend on their sea ice habitat (summarized in my previous blog post). As such, we argued that the scientific understanding of arctic sea ice decline and polar bear ecology is more credible than the viewpoints put forward on contrarian blogs. However, providing new ecological evidence was not the point of this paper. The point was to investigate how our current ecological understanding is conveyed and distorted in the blogosphere.

If some people think that our conclusion is wildly wrong, then they could at least show some evidence to prove their point, right? They probably realize that our conclusion is robust, so instead they try to nitpick on details and make it appear as if that undermines our conclusion. It does not.


Appendix: A collection of PCA graphs depicting our results, all basically underscoring the main conclusion that one group of blogs correctly conveys our current scientific understanding, while another group of blogs distort this understanding and promotes a very different viewpoint regarding sea ice and polar bears.

From top to bottom the following PCA figures are shown:

  • As published in the Bioscience paper, in which missing values are replaced by zero after scaling the data
  • List-wise deletion of all records with missing values, considerably reducing overall sample size
  • Using multiple imputation with logistic regression (5 rounds of 40 iterations each)
  • PCA figure of the same data as produced by Richard Tol, where sample size of each location in the graphs is depicted by symbol size
  • PCA figure of the same data as produced by RomanM at ClimateAudit, without information on sample size

As mentioned in the supplemental information with our paper, jittering was applied to our PCA figure to gently offset data with the exact same entries from each other for graphical purposes. Tol uses an alternative method to provide information on sample size for specific data entries, namely via the size of the symbol used in the figure. Whatever your preference, the conclusion drawn from these figures is the same: there is a clear gap between the consensus in the scientific literature and science-based blogs on the one hand, and contrarian blogs on the other hand. We thank Roman Mureika and Richard Tol for underscoring the validity of our conclusion.

There once was a polar bear – science vs the blogosphere

November 29, 2017 by

Blogs on which man-made climate change and its impacts are downplayed are far removed from the scientific literature. That is the conclusion of a new article in Bioscience in which a variety of blogs was compared with the scientific literature regarding the shrinking Arctic sea ice and the impact on polar bears.

Although there is strong agreement within the scientific community about anthropogenic causation of recent climate change, a large segment of the general public has doubts about these conclusions. This is sometimes referred to as the ‘consensus gap’. Blogs and other social media play an important role in spreading misinformation, which fuels the distrust in science.

Jeff Harvey, a Canadian ecologist working at the Netherlands Institute for Ecology (NIOO-KNAW) and the Free University of Amsterdam (VU), set out to investigate how the information on blogs relates to the scientific literature. The focus was on conclusions about Arctic sea ice and polar bears. The results have been published in the article “Internet Blogs, Polar Bears, and Climate-Change Denial by Proxy” in the journal Bioscience. Disclaimer: I’m a co-author of said article.

So what did we find? There is a clear separation amongst blogs, where approximately half of the 90 blogs investigated agree with the majority of the scientific literature, whereas other blogs took a position that is diametrically opposed to the scientific conclusions. Most of the blogs in the latter group based their opinions on one and the same source: Susan Crockford.

90 blogs and 92 scientific articles were classified according to six statements about Arctic sea ice and polar bears and the citation of Crockford. The figure shows the results of a principal component analysis (PCA) of the results. PCA is a technique to show the maximum amount of variation in a dataset with a minimum of newly defined parameters, the so-called principal components. The score on PC1 shows a separation between on the one hand the position that Arctic sea ice extent is shrinking and that this poses a threat to polar bears (most scientific articles and science-based blogs) and on the other side the position that Arctic sea ice is not shrinking or that it’s due to natural variability and that polar bears are not threatened (pseudo-skeptical blogs).

Arctic Sea ice

Arctic sea ice has shrunk dramatically in the past few decades, both in surface area and in thickness. This trend is expected to continue with ongoing global warming as a result of greenhouse gas emissions. Of course the decrease in sea ice doesn’t happen monotonically, but rather with ups and downs as a result of natural variability. When it happens to fit their perspective, such short term fluctuations are framed as a ‘recovery’ on certain blogs, or the decrease in Arctic sea ice is downplayed in other ways.

Polar bears

Polar bears depend on sea ice for catching their main prey, seals. So their habitat literally melts away as temperatures rise. Over time, polar bears have become iconic symbols of the negative effects of global warming. The population has been relatively stable so far, but you can’t just extrapolate that to the future. Biological impacts are often non-linear, and their dependence on sea ice means that in the future polar bears will likely face difficulties from continuing warming trend. Indeed, they have been classified as ‘vulnerable’ by the International Union for the Conservation of Nature (IUCN) and as ‘threatened’ under the US Endangered Species Act.

“No climate report is complete without an obligatory photo of a polar bear balancing on a piece of ice”, John Oliver said in the famous 97% episode of “Last Week Tonight”.

But what about the previous interglacial?

The polar bear species has survived the previous interglacial ~125,000 years ago. Some deduce from that that the polar bear will be fine. However, if CO2 emissions aren’t drastically reduced temperatures will get a lot warmer over the coming centuries and even millennia than during the previous interglacial. Moreover, during the previous interglacial summers were probably not completely ice-free, as is expected to happen  later this century as a consequence of continuing warming (which of course depends on how global emissions evolve). The current warming trend is many times faster than back then, making potential adaptation to new conditions more difficult. Besides shrinking sea ice there are currently also other factors that negatively affect polar bears, such as human settlements, industrial activities, hunting, bio-accumulation of toxins, and smaller seal populations.

Blogs

A future with ‘business as usual’ emissions doesn’t look bright for the polar bear. Blogs appear to fall into two camps in how they write about this topic. On pseudo-skeptical blogs scientific uncertainty is twisted into ignorance, or the current situation is extrapolated into the future without taking into account the available knowledge of polar bear ecology. They usually don’t base themselves on the scientific literature, but rather on the statements of one person. These rather unfounded opinions are consequently recycled via the blogosphere, which in this respect acts as an echo-chamber. Susan Crockford writes a lot about polar bears, but does so mostly on her own website and for anti-mitigation thinktanks such as the Heartland Institute and the Global Warming Policy Foundation (GWPF); not in the scientific literature.

The gap between scientific conclusions and pseudo-skeptical blogs will not be a great surprise to those who closely follow both the scientific and the public debate about climate change. After all, this tendency is more generally visible than only on the topic of Arctic sea ice and polar bears. This is however the first time that this has been demonstrated on the basis of a systematic comparison between the scientific literature and blogs. To close the consensus gap the authors call on their fellow scientists to actively participate in the public debate.

Zie de Nederlandse versie op ons klimaatverandering blog.


Updates:

The Supplementary Information that was part of the paper submission is still not available on the OUP website despite our repeated request to do so asap. In the meantime you may download the SI here. The data (scores per blog and per scientific article) are available via Dryad.

There has been quite some media attention for this study. Below an incomplete listing (for Dutch pieces see the abovementioned link to my Dutch sister-blog).

Polarised debate: polar bear blogs reveal dangerous gap between climate-change facts and opinions (NIOO press release) (reposted at several other places)

New study uncovers the ‘keystone domino’ strategy of climate denial (The Guardian)

Writers behind climate-change denial blogs ignore science, study finds (Toronto Star and many other Canadian newspaper outlets)

Polar Bear Blogs Denying Climate Change Are Being Used to Spread Conspiracy Theories Around the Globe (Newsweek)

Revealing the Methods of Climate-Doubting Blogs – Study shows that climate-skeptic bloggers often use limited disagreements to cast doubt on the big picture. (InsideScience)

Climate Change & Anthropocene Extinction 37: If the sea ice goes, so does the Arctic ecosystem (Bits of Science)

80 Percent of Climate Denier Blogs Reference This One Canadian Zoologist (Vice Motherboard)

How do you Spot a Climate Science Denial Blog? Check the Polar Bears (DeSmogUK)

Polar Bears Chosen as a Bizarre Symbol to Deny Climate Change, Scientists Say (DeSmogCanada)

Nearly all climate-change denial blogs quote exactly the same dubious research (International Business Times)

Unsurprisingly, the article gave rise to very different reactions, which easily fell into two camps (sounds familiar?): “insightful overview” vs “stupidest paper ever”…

A critical look at “The uncertainty has settled” documentary by Marijn Poels

July 17, 2017 by

(Zie de Nederlandse versie door Jos Hagelaars op ons Klimaatverandering blog)

The documentary “The uncertainty has settled” from Dutch filmmaker Marijn Poels follows him on his journey in rural Austria and Germany to witness how energy policies impact traditional agriculture. That is the stepping stone to also look into different ideas about how and why the climate is changing. Unfortunately Poels has no clue how to distinguish fact from fiction, and by his own admission he has no interest in making that distinction. As a result the documentary offers a mix of basic scientific insights, plain falsehoods, and misleading statements regarding climate science. As an unwitting viewer you are left utterly confused –cued by Poels’ facial expression at those times- how to reconcile these seemingly opposing viewpoints. Creating confusion was apparently his objective (as he acknowledges on his website), but it makes for a surreal experience if you know you’re being fooled. I think spreading falsehoods is doing a disservice to the public, as I’ve said to Marijn Poels during a radio-debate (in Dutch).

Let’s look more closely at some of the things being said about climate change in the documentary.

Marijn Poels meets another Dutchman in rural Germany, who laments how climate policies have led to the disappearance of local nature. He says it’s insane to think that a CO2 concentration as low as 0.035% (currently 0.04%) could have any impact on climate. That’s clearly fallacious reasoning (argument from incredulity): there are plenty of examples of compounds that have serious impacts at the same or lower concentrations (e.g. a CO detector will sound the alarm at such a concentration and you had better leave the premises). Without any CO2 in the air the globe would quickly become a frozen ball of ice, since the main air constituents (nitrogen 78%, oxygen 21%, argon 1%) don’t impede the infrared heat loss to space.

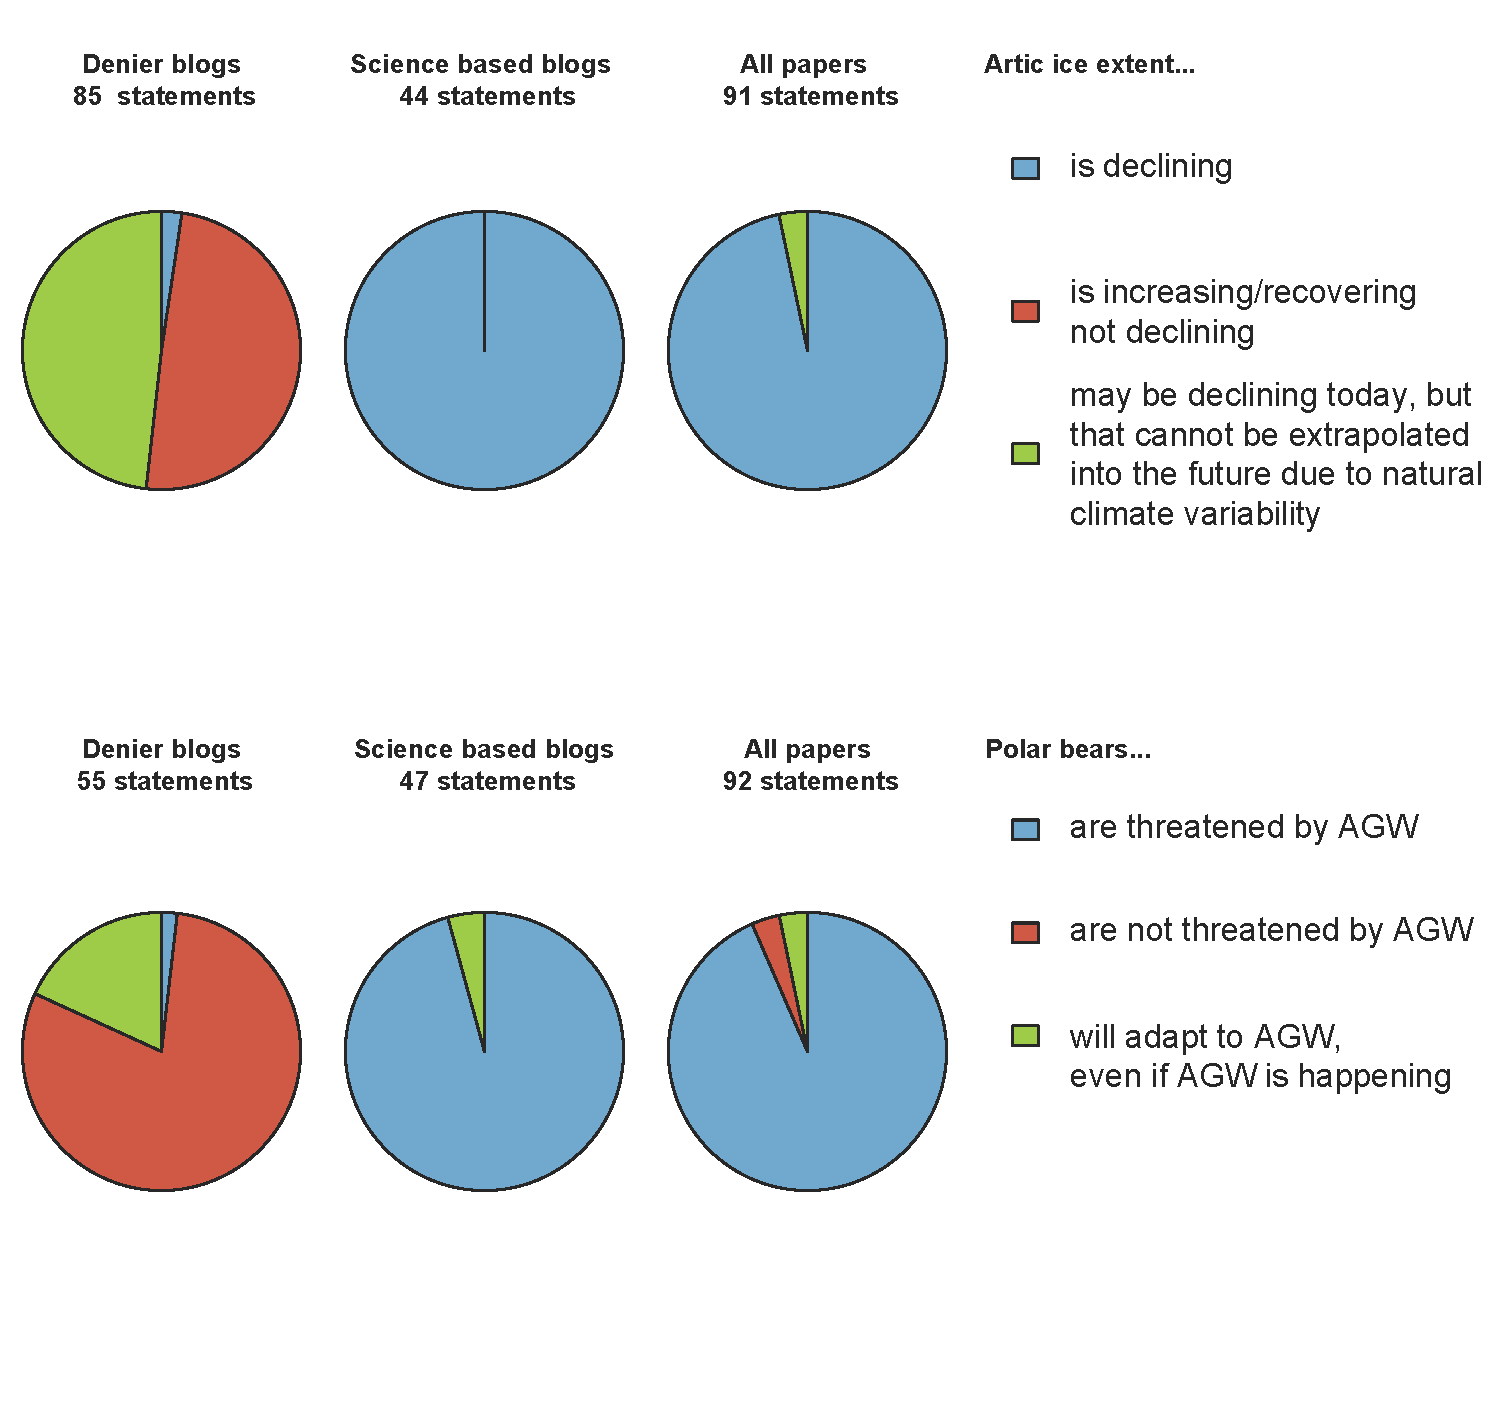
Later in the documentary he meets with climate scientist Hans von Storch, astrophysicist Piers Corbyn and physicist Freeman Dyson. Those in the loop will immediately recognize that this is not at all a fair representation of the scientific debate, but rather provides a very skewed vision thereof by emphasizing outlier views that are demonstrably false.


Hans von Storch accurately describes our current knowledge about climate change: We know that the earth has warmed and we can’t explain this warming without considering the human-induced increase in greenhouse gases in the atmosphere. He also distinguishes how scientific knowledge may be very uncertain in specific details, while the core tenets are robustly known: “The fact that CO2 has a significant influence on climate is indisputable.”

It’s astonishing how many falsehoods and conspiracy theories Piers Corbyn mentions over the course of few minutes.  Some of the things he said:

FALSE: The increasing CO2 concentration in the atmosphere is coming from the oceans

If Corbyn were right, the concentration in the ocean should have decreased in order to explain the increased atmospheric concentration (a simple consequence of conservation of mass). However, CO2 concentrations have been observed to increase both in the atmosphere and in the ocean. In reality, the excess CO2 in both atmosphere and ocean originates from fossil fuel burning, as is evident from the isotopic signature and the concomitant decrease in atmospheric O2 concentration.

FALSE: CO2 only follows temperature

During the ice age cycles CO2 acted as an amplifying feedback on the warming which was initiated by changes to the earth’s orbit. During those times of relatively slow warming the temperature indeed started to increase before the CO2 concentrations did, after which the CO2 caused even more warming. Hence it’s a bit of a chicken-egg issue with CO2 and temperature, but Corbyn’s statement is misleading. The current CO2 increase is unequivocally anthropogenic and ~100 times faster than it was in glacial to interglacial transitions. Moreover, we have known since the mid-nineteenth century that CO2 absorbs infrared radiation and thus acts as a greenhouse gas which impedes planetary heat loss and thus warms up the surface.

FALSE: Termites produce more CO2 than human activity does

Termites produce less CO2 than human activity does. Moreover, while anthropogenic emissions have led to the increased CO2 concentration, there’s no sign of tremendous changes in termite populations or emissions. In general, CO2 uptake and release by the biosphere (through assimilation and respiration/decomposition, respectively) approximately balance over multi-annual timescales. Termites also emit methane, another greenhouse gas, though around 40 times less than is released through human activity.  [Text about termite emissions has been updated 17-07]

FALSE: A new mini-ice age cometh

Corbyn has been predicting this for a while now (at least since 2010), but reality so far has been going in the opposite direction compared to his predictions. Scientists have investigated the potential consequences of a quieter sun in the near future, but generally find that increased greenhouse gas concentrations will dwarf any realistic decrease in solar activity, and hence the globe will continue to warm for the foreseeable future.

CONSPIRACY THEORY: The increased temperatures are a result of fraud with the observations

Globally averaged temperatures are computed independently by a number of different research group and they all agree within a close margin of each other. The raw data are available, so everyone who’s interested and who has the requisite skill can try to reproduce (or falsify) these calculations. A number of ‘skeptical’ people have indeed done so, and lo and behold, they found the same result: the globe really is warming.

Corbyn continues with his conspiracy theories and doesn’t even seem bothered that they’re mutually inconsistent with each other: on the one hand he claims that the ‘climate ideology’ has been made up by international big business interests, on the other hand he also claims that the ‘myth of climate change’ is a scheme to de-industrialize the West. How can you possibly take someone like this seriously?

Next up is renowned physicist Freeman Dyson, who is very skeptical of the ability of climate models to make accurate projections of future warming. In the documentary he paints a false dichotomy between observations on the one hand and models on the other hand, whereas in modern science they really go hand in hand and models form an integral part of science. Model simulations agree very well with observations, despite Dyson’s claims to the contrary. For good measure he also throws in a conspiracy theory by claiming that climate modelers only want to scare people, because they wouldn’t get money for their research otherwise. This goes to show that otherwise brilliant people can still make silly claims about a field of science that they don’t know much about.

So why did Marijn Poels chose to interview people who are demonstratively wrong (and who are not actually climate scientists)? His whole idea with the documentary was as a personal quest in which he listened to various viewpoints without judgment or evaluation. In a radio-debate I did with him on Dutch Radio NPO1 he proclaimed that he doesn’t feel any responsibility to figure out who’s talking sense and who’s talking nonsense. On twitter he has since confirmed that he doesn’t care what true and what’s not. I find that a very strange attitude for a documentary-maker, as I tried saying at the end of the radio-debate:

Scientists are seeking a better understanding of the world around us. What I hear Marijn Poels say is that it doesn’t matter to him what’s true and what’s not. That goes against everything I value as a scientist.

He also tweeted that “if there are multiple scientific perspectives, then it’s worthy of debate”. So the problem is not only that he doesn’t care about whether something is true or not; he doesn’t see that some of what he calls “scientific perspectives” are plain untruths. Claiming that the CO2 might just have come out of the ocean is no more a ‘scientific perspective’ than claiming that vaccines cause autism or that smoking is not linked to cancer. Science has conclusively shown these statements to be false.

In a public debate about smoking regulation there’s no point in discussing whether smoking is really bad for you: we know that by now, based on scientific evidence.

Likewise, in a public debate about climate policies  there’s no point in discussing whether CO2 really contributes substantially to climate change: we know that by now, based on scientific evidence.

I’ll march for science, because the truth and the pursuit of truth matters. A lot.

April 20, 2017 by

This saturday 22 April a global March for Science will take place in around 500 hundred cities worldwide. I’ll take part in the Amsterdam March for Science, taking place between 12:00 and 16:00 on Museumplein. You can find me in the “discovery” tent with some posters about climate change and sustainable energy.

Science and rational thinking has brought a lot of good to the world. Facts and a good understanding of the situation are important input for making wise decisions. Scientists should be able to do their work in freedom, not being hindered or silenced by political pressure. Science is not just another opinion. I value the truth and the pursuit of truth. That’s why I will join the march for science.

Great 4 minute video by Neil deGrasse Tyson about the value of science:

Other reading:

FAQ on the America March for Science website.

I’m a Scientist. This is What I’ll Fight For. Strong, US-centered essay by Jonathan Foley:

“The War on Science is more than a skirmish over funding, censorship, and “alternative facts”. It’s a battle for the future, basic decency, and the people we love.”

He wrote quite a few more readable pieces on the war on science.

No, you’re not entitled to your opinion.

“You are only entitled to what you can argue for. (…) false equivalence between experts and non-experts is an increasingly pernicious feature of our public discourse. (…) If ‘Everyone’s entitled to their opinion’ just means no-one has the right to stop people thinking and saying whatever they want, then the statement is true, but fairly trivial. No one can stop you saying that vaccines cause autism, no matter how many times that claim has been disproven. But if ‘entitled to an opinion’ means ‘entitled to have your views treated as serious candidates for the truth’ then it’s pretty clearly false. And this too is a distinction that tends to get blurred.”

Earth’s temperature over the past two million years

October 6, 2016 by

A new reconstruction of global average temperature over the past two million years has recently appeared in Nature (Snyder, 2016). That is quite a feat and a first for this duration. The figure below, made by Jos Hagelaars, shows Snyder’s temperature reconstruction, combined with the observed warming since 1880 and projected warming until the year 3000 for two IPCC scenarios, RCP6.0 and RCP8.5.

snyder-et-al-2016-rcp8-5-rcp6-0-nr3

The RCP8.5 can be viewed as a “no mitigation” scenario, whereas RCP6.0 would be a “limited mitigation” scenario. It is clear that in both scenarios global warming over the next centuries will take us out of the temperature realm of the past two million years. A similar figure (which I tweeted yesterday) but then with temperature projections stopping in the year 2100 can be found here.

Even though lauded as a very valuable and novel contribution to the field, Snyder’s reconstruction has also been criticized because the temperature amplitude between glacial and interglacial states appears relatively large (~6 degrees) compared to other recent reconstructions, e.g. by Shakun et al (2012) (~4 degrees). Somewhat related, Snyder estimates the global average temperature during the previous interglacial (Eemian) to be warmer than now, whereas e.g. Hansen et al (2016, under review) argue that they are similarly warm. By the way, sea levels were 6 to 9 metres higher in the Eemian than now. Sea level responds very slowly to a change in temperature, yet another sign of the vast inertia in the climate system.

Shakun_Marcott_HadCRUT4_A1B_Eng

Somewhat overshadowing the actual temperature reconstruction that Snyder presented was her calculation of an earth system sensitivity (ESS) based on a correlation between temperature and CO2 over the past few glacial cycles. The earth system sensitivity denotes the long-term temperature response to a doubling in CO2 concentrations, including e.g. the response of ice sheets (which is typically excluded from the more often used equilibrium climate sensitivity, ECS). She then applied the ESS value of a whopping 9 degrees, obtained from this simple correlation, to the current warming, stating in the abstract:

This result suggests that stabilization at today’s greenhouse gas levels may already commit Earth to an eventual total warming of 5 degrees Celsius (range 3 to 7 degrees Celsius, 95 per cent credible interval) over the next few millennia as ice sheets, vegetation and atmospheric dust continue to respond to global warming.

Where “commit” means that this level of warming would be eventually expected based on current CO2 concentrations.

As Gavin Schmidt wrote, this is simply wrong.

The reason why I think it’s wrong is that in her calculation of ESS she takes the radiative forcing caused by albedo changes (resulting from the massive change in ice coverage between a glacial and interglacial state) and assumes it to be a feedback on the CO2 induced temperature-change.

There are two issues with this:

1) In reality both the changes in albedo (reflectivity) and CO2 concentration are feedbacks on the orbital forcing, and the relation in the one direction (a change in earth’s orbit causing a temperature change which in turn causes albedo and CO2 levels to change) is not necessarily the same as the relation in the reverse direction, as is currently happening with human-induced increases in CO2. Gavin Schmidt makes this point in two consecutive posts at RealClimate (here and here), though you might also want to read Hansen’s take, who has used a similar approach as Snyder did).

2) The ESS value obtained would (ignoring the more complex first point) perhaps be applicable to a glacial-interglacial transition, but decidedly not to an interglacial-‘hyperinterglacial’ transition, where the ice-albedo feedback would of course be much smaller because of the much smaller ice-covered surface area.

This second point was also made by James Annan in response to Hansen’s 2008 Target CO2 paper, where he essentially used the same method as Snyder is using (but came to a smaller ESS value of 6 degrees, because Snyder uses a greater temperature-amplitude between glacial-interglacial). Hansen noted in his paper though that “The 6°C sensitivity reduces to 3°C when the planet has become warm enough to lose its ice sheets.”

In other words, using Snyder’s very (and probably too) high ESS value to project future warming is unwarranted and wrong.

Climate inertia

August 9, 2016 by

Imagine you’re on a supertanker that needs to change its direction in order to avoid a collision. What would you do? Would you continue going full steam ahead until you can see the collision object right in front of you? Or would you try to change course early, knowing that changing a supertanker’s course takes a considerable amount of time?

The supertanker’s inertia means that you have to act in time if you wish to avoid a collision.

The climate system also has a tremendous amount of inertia built in. And like with the supertanker, this means that early action is required if we want to change the climate’s course. This inertia is a crucial aspect of the climate system, both scientifically but also societally – but in the latter realm it’s a very underappreciated aspect. Just do a mental check: when did you last hear or read about the climate’s inertia in mainstream media or from politicians?

Inertia

The inertia of the climate system could be compared to that of a supertanker: if we want to change its course, it’s important to start steering the wheel in the desired direction in time.

Why is it so important? Because intuitively many people might think that as soon as we have substantially decreased our CO2 emissions (which we haven’t), the problem will be solved. It won’t, not by a very long shot. Even if we reduce CO2 emissions to zero over a realistic timeframe, the CO2 concentration in the atmosphere – and thus also the global average temperature- will remain elevated for millennia, as can be seen in the figure below. The total amount of carbon we put in the atmosphere over the course of a few hundred years will affect life on this planet for hundreds of thousands of years. And if we want to reduce the amount of warming that we commit the future to, we need to reduce our carbon emissions sooner rather than later. The longer we postpone emission reductions, the stronger those emissions reductions would need to be in order to have the same mitigating effect on long-term warming.

That’s why climate inertia is so important.

Zickfeld 2013

Modeled response of the atmospheric CO2 concentration (panel b) and surface air temperature compared to the year 2000 (panel c) to prescribed CO2 emissions (panel a). The CO2 concentration remains elevated long after CO2 emissions have been reduced, because the long-term sinks for CO2 operate very slowly (see e.g. IPCC FAQ 6.2 for an explanation of these carbon sinks). Since CO2 impedes infrared heat loss, for millennia the globe will remain warmer than it was before CO2 concentrations rose. The temperature lags behind the CO2 concentration because of the time it takes for the oceans to warm up. Figure from Zickfeld et al (2013).

As I wrote before: Postponing meaningful mitigation action until the shit hits the fan comes with considerable risk, because many changes in climate are not reversible on human timescales. Once you notice the trouble, it’s only the beginning, because of the inertia in the various systems (energy system, carbon cycle and climate system). The conundrum is thus that those who caused the problem are in the best position to solve it, but since the full consequences will not materialize until much later, they have the least incentive to do so.

Over at Bits of Science two Dutch science journalists, Rolf Schuttenhelm and Stephan Okhuijsen, published an interesting piece that focuses on the same issue: we only see a portion of the warming that we have committed ourselves to, due to the thermal inertia provided by the oceans. Just as a pot of water doesn’t immediately boil when we turn on the stove, the oceans take time to warm up as well. And since there’s a lot of water in the oceans, it takes a lot of time.

They included the following nifty graph, with the observed surface temperature but also the eventually expected temperature at the corresponding CO2 concentration (which they dub the ’real global temperature’), based on different approaches to account for warming in the pipeline:

real-global-temperature-graph - Bits of Science

Observed and eventually expected (“real”) temperature at concurrent CO2 concentration, via Bits of Science

This is a nice way to visualize the warming that’s still in the pipeline due to ocean thermal inertia. From a scientific point of view the exact execution and framing could be criticized on certain aspects (e.g. ECS is linearly extrapolated instead of logarithmically; the interpretation that recent record warmth are not peaks but rather a ‘correction to the trend line’ depends strongly on the exact way the endpoints of the observed temperature are smoothed; the effect of non-CO2 greenhouse gases is excluded from the analysis and discussion), but the underlying point, that more warming is in store than we’re currently seeing, is both valid and very important.

Timescales, timescales, timescales. Why art thou missing from the public discussion about global warming?

Update: ClimateInteractive has a good simulation of how this inertia works out in practice. By moving the slider at the bottom the figure you can choose between different emission scenarios. In the graphs above you then see the effect this has on the CO2 concentration, the global average temperature, and the sea level, and how this response is damped. The further down the cause-effect chain, the more damped – or better: the more slowed down- the response is. The sea level will continue to rise the longest (even long after the temperature has stabilized or even starts decreasing), but will take a while to get going. This simulation only runs to the year 2100 though.

A Dutch version of this post can be found on my sister blog KlimaatVerandering.