It is well known that the Arctic is warming up much faster than the rest of the globe. As a consequence, datasets which omit this region (HadCRUT and NOAA) underestimate the global warming trend. A new paper by Cowtan and Way addresses this cool bias by using satellite data to fill in these data gaps. They make a good case that this method also improves upon the NASA GISS dataset, which uses extrapolated data from surface stations to partly fill in the data sparse regions. Combining their new method of infilling with the most up-to-date sea surface temperatures gives a substantially larger trend over the last 15 years than the abovementioned datasets do. The temporary slowdown in global surface warming (also dubbed “the pause”) nearly disappears. As Michael Tobis notes:
This demonstrates is how very un-robust the “slowdown” is.
The corrections don’t amount to a huge change in absolute temperature change, and the new data actually fall inside the uncertainty envelope provided by HadCRUT4. As the paper correctly states:
While short term trends are generally treated with a suitable level of caution by specialists in the field, they feature significantly in the public discourse on climate change.
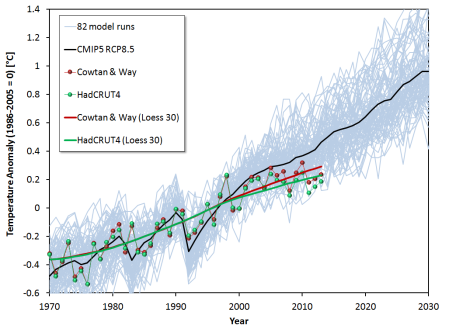
In the figure below (made by Jos Hagelaars) the global average temperature as calculated by Cowtan and Way (“C&W hybrid”) is compared to both the HadCRUT4 dataset and the CMIP5 multi-model mean as well as its 5% and 95% percentile values (RCP8.5): [Update: The figure below has
been replaced, since the original was found to be in error during discussions on CA). The confidence interval of this corrected graph is substantially narrower than the erroneous original one. Note that the current graph shows the 5 to 95 percentile range of model runs (i.e. the 90% confidence interval), whereas the previous ones showed the 95% confidence interval. At the bottom of the post a similar figure with both confidence intervals as well as the two sigma range is shown.]
Also with these data improvements, recent observations are at the low side of the CMIP5 model range. The comparison of observations to models has to be interpreted with caution however. Some people like to jump to preferred conclusions, but it’s good to keep in mind that the expected warming at a specific point in time depends on a combination of factors. Any of these factors -as well as shortcomings in the observational data, such as those discussed by Cowtan and Way- could contribute to a mismatch between observations and models:
– radiative forcing
– equilibrium climate sensitivity
– climate response time
– natural unforced variability
The last factor means that one shouldn’t expect the multi-model mean (in which most variability is cancelled out) to be identical to the observations (which are the result of a particular realisation of natural variability).
Cowtan and Way made a very clear video in which the main results of their paper are explained in just a few minutes. Highly recommended watching:
More commentary on the paper on e.g. RC (Rahmstorf), SkS (Cowtan and Way), Guardian (Nuccitelli), P3 (Tobis), Victor Venema, Neven. See also this very useful background information provided by the authors.
[some typos corrected and clarifications added, 16-11. Erroneous figure replaced 21-11.]
Update: Below a similar figure as above, with different confidence intervals for the model runs shown.
Update 2 (Feb 2014):
Jos Hagelaars added Cowtan and Way’s data for 2013 to a figure comparing observations to model projections:


