Bray and von Storch just published the results of their latest survey of climate scientists. It contains lots of interesting and very detailed information, though some questions are a little biased in my opinion. Still, they find a strong consensus on human causation of climate change: 87.4% of respondents are to some extent convinced that most of recent or near future climate change is, or will be, the result of anthropogenic causes (question v007). Responses were given on a scale from 1 (not at all) to 7 (very much). In line with Bray (2010) a response between 5 and 7 is considered agreement with anthropogenic causation. In their 2008 survey the level of agreement based on the same question was 83.5% and in 2013 it was 80.9%.

Question v013 asked a somewhat similar question as we did in our 2012 climate survey, namely the percentage of global warming that is attributable to human activities:
1=0% 2=1-25% 3=25-50% 4=51-75% 5=76-100%

84.2% of respondents picked one of the two answer options that correspond to the canonical “more than half” or “most” of global warming that according to the IPCC is human caused. However, the corresponding IPCC statement is with regards to warming since the 1950’s, about which there is a lot more confidence, whereas this question specifies the warming since 1850.
But wait a moment, hasn’t the earth warmed a lot more than 0.5-0.7 degrees C since 1850? Yes, it definitely has; we’ve recently breached the 1 degree mark relative to the 1850-1880 average, so the range given in their question is quite outdated. A defensible choice at the time of drafting the survey would have been to quote the latest IPCC number of 0.85 (0.65 to 1.06) degrees warming over the time period 1880-2012, even if current temperatures have gone up sharply since then.
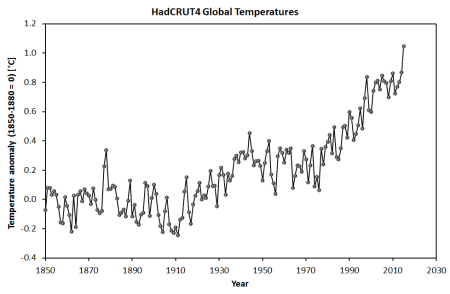
Global average surface temperature relative to the 1850-1880 mean. Last annual average shown is 2015; if the first few months of 2016 are a guide, the vertical scale might have to be adapted for 2016. Figure by Jos Hagelaars.
Moreover, the answer options for v013 do not cover the full range of possibilities. Natural factors could have caused warming or cooling. Imagine that natural factors would have caused a cooling of 0.1 degrees C since pre-industrial times (which is not at all implausible), then to achieve closure with the observed warming of 1.0 degrees, anthropogenic factors should have contributed 1.1 degrees, or 110% of the observed warming. We discussed this argument in detail in our ES&T paper emanating from the climate science survey we conducted in 2012.
I emailed Dennis Bray about these and other issues after having responded to their survey back in 2015. He defended their choice of lowballing the observed warming as being consistent with their previous surveys and not being much different from more recent, and also likely contested, estimates. Strangely, he disagreed with the possibility of a factor being responsible for more than 100% of the observed warming, even in the hypothetical example above.
Cook et al (myself included) recently wrote an article in which we reviewed the existing ‘consensus’ estimates. This latest Bray and von Storch survey finds a level consensus on attribution that is consistent with other studies, though towards the lower end of the range. From their description I don’t think there is a bias in their sample of scientists, though there is always the possibility of self-selection, where people might be more likely to respond to a survey if it originates from a source who they perceive to be credible. Repeatedly, surveys have found that the level of consensus goes up as you zoom in to a sample of scientists with more relevant expertise. The Bray and von Storch results, as are ours, are mostly representative of a broad group of climate related scientists.
A detail of particular interest to me is that the survey questions included the response option “no answer”. That explains the different sample size for different questions (“Number of obs”). It’s probably no coincidence that question v013 (asking for a specific range of percent contribution) has a smaller sample size (n=587), and by inference more “no answer” responses, than the other, but simpler, attribution question v007 (n=640). This is consistent with what we found in our 2012 climate science survey: fewer respondents picked a specific percentage range of attribution compared to providing a qualitative judgment thereof. Though admittedly “no answer” (in the Bray and von Storch survey) is less ambiguous in this context than “I don’t know”, “unknown” or “other” (in our survey).
Amidst the questions on science and society I perceived some questions to have an “anti-consensus” (v069) or “anti-alarmist” (v067) tone to it, but there were no questions asking for mirror image perceptions. Doomsday stories need to be investigated before they get out of hand (v067): of course. But no question was asked whether stories downplaying a scientifically established risk should be investigated. I would have likewise responded: of course. To his credit, Dennis Bray acknowledged in his email that this was an oversight on their part.
Tags: Attribution, Climate Science Survey, Consensus, Dennis Bray, global warming, Hans von Storch

June 22, 2016 at 18:13
We’d have to be in pretty dire straights if this sort of obviousness is worth the time posting by Mr. Verheggen.
The human component has been established ever since we could measure isotopic properties of these airborne molecules, which was before I was born, and I’m not exactly young…
Aye aye aye!
June 22, 2016 at 21:44
Pier,
“The human component has been established ever since we could measure isotopic properties of these airborne molecules …”
Well, to be fair, that concerns just the human causation of the increase in the CO2-concentration. One might rightly say that was settled with the work by Willard Libby, Roger Revelle, Hans Suess and others in the mid 1950’s:
https://www.aip.org/history/climate/Revelle.htm
Which was confirmed a short while later by the measurements by Keeling.
Attribution of climate change however — since the 1850’s as Bray and Von Storch asked or since 1951 such as the IPCC states — is a different question than only the causation of the increase in the CO2-concentration.
I concur with Bart that human causation may quite well be responsible for > 100% of the increase in GMST since 1950. This is illustrated in the figure bottom left:
However, the > 100% is not presently established to be ‘extremely likely’, therefore the IPCC only concludes:
“It is extremely likely that more than half of the observed increase in global average surface temperature from 1951 to 2010 was caused by the anthropogenic increase in greenhouse gas concentrations and other anthropogenic forcings together. The best estimate of the human-induced contribution to warming is similar to the observed warming over this period.”
June 23, 2016 at 00:09
Maybe I missed it. It would be more convincing if I knew how the respondents were selected and how their numbers relate to the scientific population.
June 23, 2016 at 00:27
Hi Bob,
Thanks for you reply. All I meant to imply is that, it being so late in the game, it is sad that this still needs pointing out. We should have been heeding yje consequences into this many, many decades ago and we did nothing and only managed to up our emissions per annum by 60% since the first IPCC report came out. Not because our knowledge was insufficient, but because we have been, and still are, acting like nicotine addicts..
In other words, the time for consensus reports lies way behind us.
We do far too much fudging and semantic wizardry in integrated assessment models for any of it to matter. We are only willing to make marginal adjustments and think they will somehow produce major changes..
Glad to know most scientists agree on CO² when it comes to its radiative forcing potential, but seriously.. meh?
June 23, 2016 at 01:25
“I would have likewise responded: of course. To his credit, Dennis Bray acknowledged in his email that this was an oversight on their part.”
Oddly, it is an oversight that has persisted through several prior iterations of the survey. I expect it will be iterated in further versions as well.
June 23, 2016 at 09:35
Hartog,
Their report (also linked to from the post) explains how respondents were selected:
Further details are in their report. The sample is large and unbiased enough to be considered representative is my feeling, though some countries (e.g. Germany) might be slightly overrepresented.
Tom,
It might well be that some biases have persisted in several iterations of the survey -I didn’t go into that detail, so I don’t have an opinion on that for now- but the specific questions I mentioned in the end (v067 and v069) were not included in the previous two surveys they did. So it might very well have been a genuine oversight.
June 23, 2016 at 13:32
In my opinion the relatively low response rates in Bray & Von Storch (17%) and in Verheggen et al. (29%) indicate that self-selection effects might be quite influential here.
These low response rates are not unheard of, by the way. For example, a dutch survey of all primary care physicians registered with the KNMG (Royal Dutch Medical Association) had a similar response rate of 34%. Mind you, this was a survey by their *own* professional organisation.
If only 17% or 29% of the professionals surveyed actually take the trouble to fill-in the whole survey and return it… only the most motivated will do so!
Climate scientists with views different from the mainstream — ‘sceptics’ such as Spencer, Christy, Lindzen and Curry — wil be VERY motivated to respond since this is their chance to get their minority opinions heard. I’d expect them to jump at the opportunity.
On the other hand, those with mainstream views may well think: “Blah… another survey on what everybody already knows? Of course humans are responsible for most of the recent warming, just read the IPCC report. I’ve got more important things to do.” They are not as motivated to get their opinions heard.
I would suspect the response rate to be considerably higher in the group with views which differ from the majority.
June 23, 2016 at 13:54
Hi Pier,
“All I meant to imply is that, it being so late in the game, it is sad that this still needs pointing out.”
I do agree. However, in your initial reaction you mentioned “isotopic properties” to establish the human component in — supposedly — climate change. That is not correct or at least it is only a part of the evidence.
These surveys not only show that the vast majority of climate scientists “agree on CO² when it comes to its radiative forcing potential“, but they go quite a bit further than that. They actually show considerable agreement on the attribution of recent climate change.
In my opinion, the surveys as they are done by Bray & Von Storch, Verheggen and others are still rather useful because they sample the (increasing) degree of consensus among climate researchers on a number of relevant questions. They are not ‘perfect’, but still very useful.
June 23, 2016 at 22:05
Bob,
I think those are actually pretty decent response rates. As you rightly note, ‘internal’ surveys (e.g. an employers surveying their employees) usually have higher resonse rates, but 20-30% for an ‘external’ survey is fairly common.
We actually checked to what extent the respondents were representative of the larger sample that we invited. And indeed, those scientists who were tagged to be ‘unconvinced’ (based on their own public statements) were more likely to respond than others: 3% of the invitees wre tagged as ‘unconvinced’ vs 5% of respondents (see figure S1 in the suppl info http://pubs.acs.org/doi/abs/10.1021/es501998e). Not a huge impact, but noticeable nevertheless.
June 23, 2016 at 23:45
I’d like to actually see an extra set of potential answers for questions about quantification of attribution, distinguishing between cases where the respondent feels he’s not qualified to say, and when the respondent feels that the scientific evidence is unclear.
BV, I was thinking of your 2014 paper (2012 poll?), in which the “undetermined” answers were sometimes relatively high. It’d be neat to break that down further. Say that we take a question about the ECS. You could have:
– Answers 1-N, each for some range of warming.
– “The evidence is unclear; scientists don’t know”.
– “I don’t know”.
This would basically group respondents by four categories: “warmists”, who expect within-consensus amounts of warming, “deniers”, who expect low warming, “skeptics”, who are unsure, and honest outsiders, who are not sufficiently knowledgeable to say.
June 25, 2016 at 15:06
[…] and have recently released the 5th International Survey of Climate Scientists, for 2015/2016. Bart Verheggen helpfully goes over the key consensus findings as well as a couple of issues with […]
June 25, 2016 at 18:04
[…] and have recently released the 5th International Survey of Climate Scientists, for 2015/2016. Bart Verheggen helpfully goes over the key consensus findings as well as a couple of issues with […]
July 1, 2016 at 06:45
The debate is over … time for action!
July 3, 2016 at 03:08
Ah, Bart. On a 7 point Likert scale best practice is reporting top 2 box. You are aggregating the top 3 boxes.
Why not go all the way and count the top six boxes? Then you’d really have a consensus.
July 3, 2016 at 09:01
Tom,
As Bray (2010) wrote in reference to the same question:
It all comes down to how you define the consensus position; that should be explained and made transparant, but there’s no need to blindly transpose some rules from an entirely different context.
Comparing the responses to v007 and v013 is also instructive: Using responses 5-7 as the consensus position in v007 (87.4%) agrees much better with the result of v013 (84.2%) than if you were to include only responses 6-7 as the consensus position (73.7%). That in my mind is a very strong argument for interpreting positions 5-7 as the consensus position. Or, at the risk of invoking some fake precision, around three quarters of the response 5 to v007 agree with the consensus position as laid out in v013 (anthro caused >50% of warming).
July 3, 2016 at 17:47
Bart, I actually believe agreement with the consensus is at about the 75% level. Maybe even a little higher. But I wouldn’t report the research findings the way you did with your paper or the way you think Bray/von Storch are doing so now.
And the reason is precisely to avoid others distorting and disputing the analysis of the figures. What happened with your paper is an excellent example.
July 3, 2016 at 18:58
Tom, I *cited* Bray (2010) and gave reasons why I think it’s appropriate to do so. You just offer somerhing along the lines of “this is how it’s usually done”, irrespective of the context or specific reasons. Sorry, but I don’t find that convincing.
July 3, 2016 at 19:41
Bart, I’m long past trying to convince you. I’ve semi-retired from blogging and this is the first time I’ve commented on a climate site in I don’t know how long.
It is perfectly normal for you, a committed member of the consensus, to to highlight data that confirms your beliefs and supports your point of view. I don’t blame you for it.
However, for those who are accustomed to looking at the results of opinion surveys, the data arrangement you are using–reporting the top 3 results for a Likert scale from 1 to 7, as opposed to the long-standing custom of reporting the top 2 to indicate strong support for the proposition in a question–will raise eyebrows, if not a red flag. It will surprise readers (not casual readers, just those who read lots of survey reports and write them as well) and raise questions.
I don’t believe I will ever convince you that it is to your advantage to report conservatively rather than trying to grab every percentage point possible under the consensus umbrella. I certainly failed when we corresponded about your survey, so I doubt if I’ll have better luck here.
But you’re just giving skeptics more ammunition.
July 3, 2016 at 19:54
For your future use (and maybe Bray/von Storch’s as well), I just finished a report using a 9-point Likert scale. This allowed me to report in 3 box frames as you do here without compromose. It also allowed for other questions to indicate shaded levels of support using top 2 box for strong support, the next 2 levels as medium support, a mid-point for neutral, and then bottom 2 box for rejection and the next tier as medium rejection.
July 5, 2016 at 14:22
Fuller brush man hawking this:
“I’ve semi-retired from blogging and this is the first time I’ve commented on a climate site in I don’t know how long.”
Aha, a GBCW comment !
July 5, 2016 at 17:52
Fuller brush man! Haven’t heard that since grade school. How clever of you. How… irrelevant to rational discussion of issues… How… typical.
July 6, 2016 at 18:06
So much for your “semi-retirement” from blogging, lol !
July 8, 2016 at 18:17
What model are they using to force all the distributions shown by the green line to bend downward at the response end. Clearly this is misleading
July 13, 2016 at 11:44
That’s not clearly explained, but it seems to be a normal (Gaussian) fit to the data. It seems to work fine for distributions where the max is somewhere in the middle, but as you rightly point out it doesn’t work (and gives a misleading visual appearance) when the max is at an extreme side of the distribution.
January 17, 2020 at 15:15
[…] Bray and von Storch just published the results of their latest survey of climate scientists. It contains lots of interesting and very detailed information, though some questions are a little biased in my opinion. Still, they find a strong consensus on human causation of climate change: 87.4% of respondents are to some extent convinced that … Read More […]